OPEN-SOURCE SCRIPT
Gap Stats v2
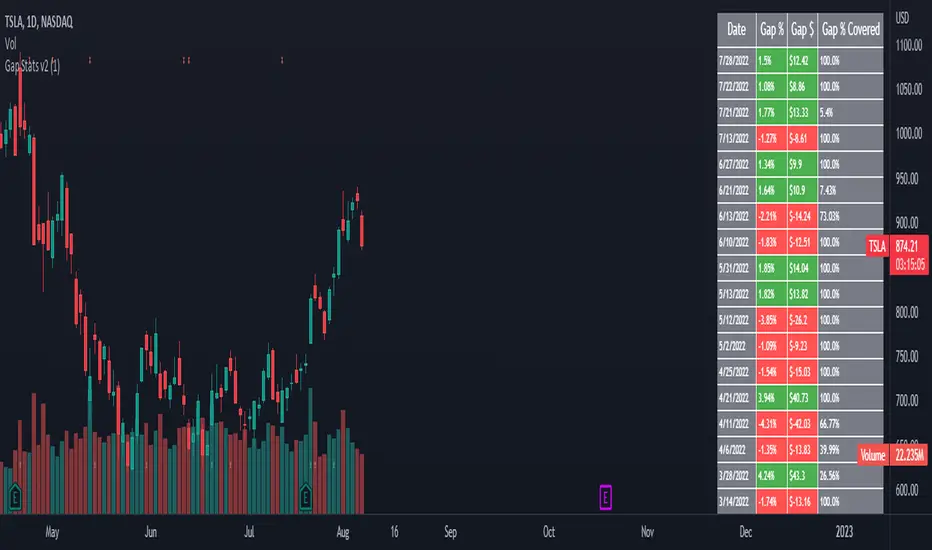
This helpful analysis tool displays a table of days a stock has gapped, how much it gapped by and what percentage of the gap was covered.
It is meant to be used on the daily timeframe and can help you distinguish if gaps are going to be filled or not. I like to use it mainly on medium + cap stocks
that have gapped overnight or pre-market and see what the tendency is with how it behaves after a major gap.
It is meant to be used on the daily timeframe and can help you distinguish if gaps are going to be filled or not. I like to use it mainly on medium + cap stocks
that have gapped overnight or pre-market and see what the tendency is with how it behaves after a major gap.
開源腳本
秉持TradingView一貫精神,這個腳本的創作者將其設為開源,以便交易者檢視並驗證其功能。向作者致敬!您可以免費使用此腳本,但請注意,重新發佈代碼需遵守我們的社群規範。
免責聲明
這些資訊和出版物並非旨在提供,也不構成TradingView提供或認可的任何形式的財務、投資、交易或其他類型的建議或推薦。請閱讀使用條款以了解更多資訊。
開源腳本
秉持TradingView一貫精神,這個腳本的創作者將其設為開源,以便交易者檢視並驗證其功能。向作者致敬!您可以免費使用此腳本,但請注意,重新發佈代碼需遵守我們的社群規範。
免責聲明
這些資訊和出版物並非旨在提供,也不構成TradingView提供或認可的任何形式的財務、投資、交易或其他類型的建議或推薦。請閱讀使用條款以了解更多資訊。