INVITE-ONLY SCRIPT
SN30 Indicator
已更新

Indicator «SN30»
Class: oscillator
Trading type: scalping
Time frame: 5 min
Purpose: reversal trading
Level of aggressiveness: standard
Indicator «SN30» is based on the linier regression and normal distribution. Regression is one of the most popular and effective methods of the time series analysis and data prediction. Indicator «SN30» uses regression analysis as an alternative to the moving averages analysis. The main aim is data series smoothing to reduce the noise in data. It allows to see market as it is, without deformation.
Using unique author algorithm indicator «SN30» searches for the optimal buy/sell zones. If they are sufficient indicator generates appropriate trading signals.
Structure of the indicator «SN30»
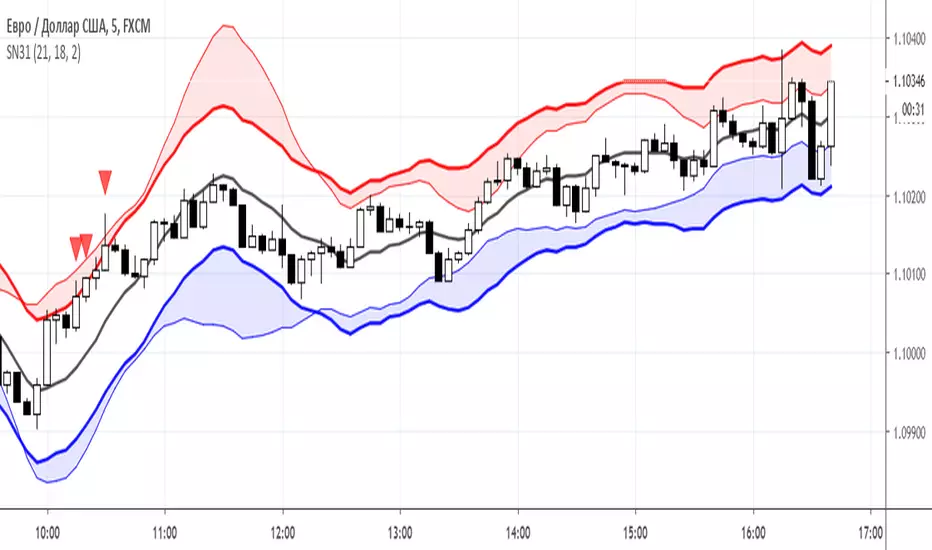
Indicator «SN30» consists of central channel line (green line based on linier regression) and price channels (2 blue and 2 red lines with colored zones between them). Colored zones are of two types: red (overbought zone) and blue (oversold zone). They are used to define deviations of the current prices from their fair values. When the price enters the red zone it should reverse soon (the prices will go down). The same is true for the blue zone (the prices will go up).
Also when the buy/sell signal is generated special signs are displayed on the chart (red and blue triangles)
Parameters of the «SN30» indicator
1. PeriodSN30 (indicator period, default value = 21) – is used to calculate fair value of the asset based on linier regression.
2. Width – defines the width of the stationary channel (indicated by bold lines). Default value = 20 pips.
3. Sigma – defines the width of the dynamic channel (indicated by usual lines). Default value = 2standard deviations. It allows fitting 95% of price values into channel. All the price values out of the channel are treated as abnormal.
Rules of trading
The indicator is designed to work on 5-minute time frames, but after additional adjustment of parameters it can be used on any other time periods.
The general principle of the “SN30” indicator is the same as that of any indicator of the oscillatory class: when the price is in the overbought zone it is interpreted as a signal of a future price reverse in the downward direction, and when the price is in the oversold zone it is a signal of a future price reverse in the upward direction.
The rules of trading are extremely simple: when the red triangle is appeared on the chart (sell signal) or a blue triangle (a buy signal), a corresponding transaction (sell or buy an asset) should be done. Stops can be placed above/below the red/blue zones.
發行說明
Default value of the "width" parameter changed from 20 to 18.Default color of the middle line changed from "green" to "black".
The name of the indicator changed from "SN30" to "SN31".
Авторские индикаторы
bit.ly/2oBvkHY
Больше информации на нашем ютьюб-канале
youtube.com/channel/UCYEOurJfasXWyYnrriGwsqQ
bit.ly/2oBvkHY
Больше информации на нашем ютьюб-канале
youtube.com/channel/UCYEOurJfasXWyYnrriGwsqQ
免責聲明
這些資訊和出版物並不意味著也不構成TradingView提供或認可的金融、投資、交易或其他類型的意見或建議。請在使用條款閱讀更多資訊。