INVITE-ONLY SCRIPT
™TradeChartist Rubicon
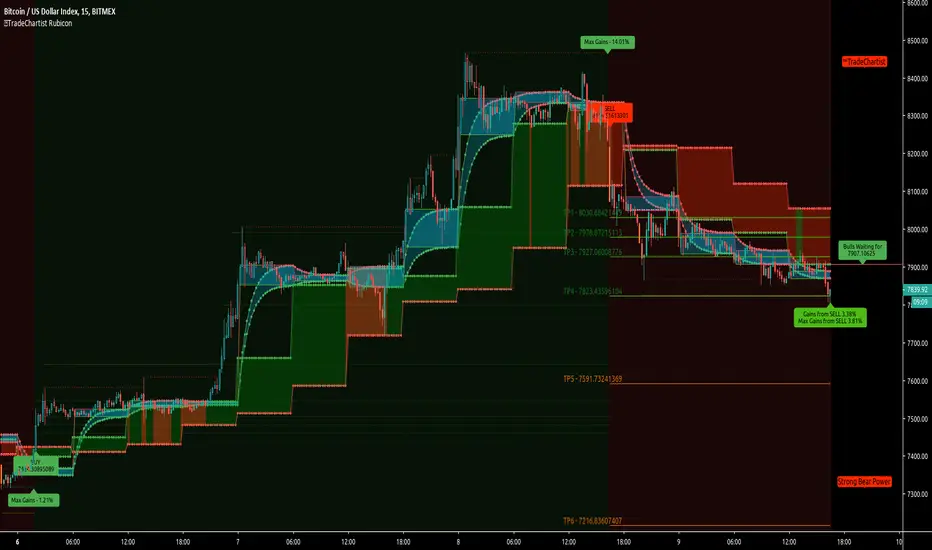
™TradeChartist Rubicon is a beautifully designed functional indicator that helps traders enter and exit Long or Short trades with ease.
This indicator is aptly named Rubicon as it studies the candles in the River of Rubicon (Flat Blue River that never stops flowing up and down the chart) through the Lands of Rubicon to find out which army (Bulls or Bears) is committing itself to crossing the River and its tides. By doing this for every price candle, the indicator generates BUY and SELL signals along with Targets and real-time Gains on the chart.
What does the ™TradeChartist Rubicon Indicator do?
Some Examples of trades using ™TradeChartist Rubicon indicator
GOLD short trade and Long trade scalping on 15m


GOLD on Daily

SUGAR-USD on 15m

AUD-USD on 5m

LEND-BTC alt pair on Daily

-----------------------------------------------------------------------------------------
This is not a free to use indicator. Get in touch with me if you would like access to the indicator for a free trial before deciding on a paid access for a period of your choice.
-----------------------------------------------------------------------------------------
This indicator is aptly named Rubicon as it studies the candles in the River of Rubicon (Flat Blue River that never stops flowing up and down the chart) through the Lands of Rubicon to find out which army (Bulls or Bears) is committing itself to crossing the River and its tides. By doing this for every price candle, the indicator generates BUY and SELL signals along with Targets and real-time Gains on the chart.
What does the ™TradeChartist Rubicon Indicator do?
- Plots very high probability BUY and SELL signals on chart
-- Real-time signals are plotted in Orange labels. (Note: Real-time signals repaint. So wait for confirmation before taking a trade position. This feature is included based on feedback from a few traders as some of them like to see a potential direction based on developing candle, its RSI, Stochastic etc.)
-- Confirmed signals are plotted in Green labels for BUY and Red labels for SELL. These signals don't repaint and can be used confidently to enter or exit a trade.
-- Option to choose type of trade opportunity from indicator settings namely - Long trades, Short trades or both, based on which the chart background colour will be green for duration of long trades or red for duration of short trades.
-- Intermediate signals are also plotted between the primary BUY and SELL signals which can be used for re-entry, scalping etc if the opportunity to enter trade at Primary signal was missed. These secondary signals marked as B and S with arrows can be deactivated from indicator settings. - Plots Target levels as soon as BUY or SELL signal is confirmed on chart.
-- These levels can be used as support and resistance levels too.
-- The first 3 TP levels can be used as a litmus test to trade higher levels as the likelihood of price hitting higher profit levels significantly increase when price crosses the first 3 smaller levels.
-- The performance of the current signal can be tracked by using the Show Gains from Primary Signal and the past signals can be accessed by checking Show Past Performance option from Indicator Settings. - Plots % Gains based on candle close in real-time and Max % Gains based on highest since the BUY signal or lowest since the SELL signal. The entry price is normally plotted along with the signals and is an indicative price based on breached resistance. Traders may choose to buy at Market Price or Limit Price based on the price movement at the time of signal generation.
- Plots Bulls/Bears waiting price points for chart time-frame if activated from settings. (Default - Not Active)
- Automatically plots Bull and Bear power labels along with visually painting the Bull or Bear power on the Lands of Rubicon.
- Plots RSI colour candles based on user preferred Overbought and Oversold RSI levels from indicator settings. (Default - 60 Overbought and 30 Oversold)
What markets can this indicator be used on? - Forex
- Stocks - works best with 4hr or above and prices calculated taking gaps into account.
- Commodities
- Cryptocurrencies
- and almost any asset on Trading View
Works really well when there is good volume , volatility or both in the asset observed/traded.
What time-frames can this indicator be used on? - This indicator can be used on 1m, 3m, 5m, 10m, 15m, 30m, 1hr, 2hr, 3hr, 4hr, 6hr, 8hr, 12hr, Daily, Weekly, Bi-Weekly and Monthly time-frames. Signal generation based on value, volume and volatility. If an asset has very little volume or is far low in comparative value against the base currency, there can be far too many erratic signals but with most assets, this won't be an issue.
Does this indicator repaint? - No and Yes
-- Once the confirmed BUY (in green) and SELL (in red) signals are posted after a candle close, it doesn't repaint.
-- Repainting happens for real time Orange label BUY and SELL signal on the current candle. Some traders prefer to see the developing signal and trade using RSI, Stochastic etc.
Does the indicator send alerts when a signal is generated?
Yes, traders can get alerts by setting Trading View alerts for BUY/SELL Signals and when a new Profit Target is achieved. For confirmed BUY/SELL alerts, 'Once per bar close' must be used.
Real-time BUY and SELL trigger alerts can also be set using 'Once per bar' or 'Once per minute' as alert frequency.
Some Examples of trades using ™TradeChartist Rubicon indicator
GOLD short trade and Long trade scalping on 15m
GOLD on Daily
SUGAR-USD on 15m
AUD-USD on 5m
LEND-BTC alt pair on Daily
-----------------------------------------------------------------------------------------
This is not a free to use indicator. Get in touch with me if you would like access to the indicator for a free trial before deciding on a paid access for a period of your choice.
-----------------------------------------------------------------------------------------
僅限邀請腳本
僅限作者授權的用戶訪問此腳本,並且通常需要付費。您可以將其增加到收藏腳本中,但是只有在向作者請求並獲得許可之後,才能使用它。 請聯繫TradeChartist以了解更多信息,或按照下面作者的說明進行操作。
TradingView 不建議購買並使用此腳本,除非您 100% 信任其作者並了解腳本的工作原理。在許多情況下,您可以在我們的社群腳本中免費找到良好的開源替代方案。
作者的說明
″
想在圖表上使用此腳本?
警告:請閱讀,然後再請求訪問權限。
Get in touch with me if you would like access to my Premium scripts for a trial before deciding on lifetime access.
Telegram - @Trade_Chartist
Free Scripts - bit.ly/Free-Scripts
Telegram - @Trade_Chartist
Free Scripts - bit.ly/Free-Scripts
免責聲明
這些資訊和出版物並不意味著也不構成TradingView提供或認可的金融、投資、交易或其他類型的意見或建議。請在使用條款閱讀更多資訊。