OPEN-SOURCE SCRIPT
Bounce Zone
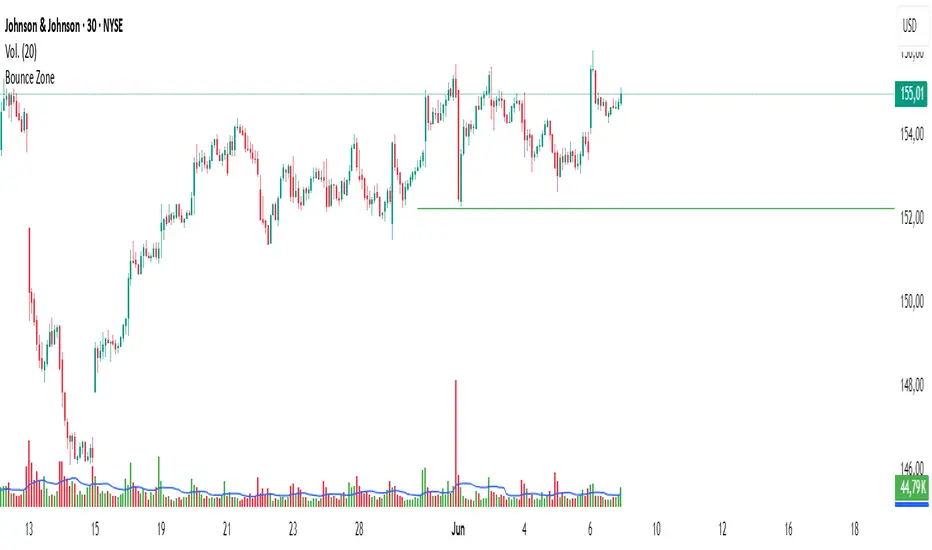
📘 Bounce Zone – Indicator Description
The "Bounce Zone" indicator is a custom tool designed to highlight potential reversal zones on the chart based on volume exhaustion and price structure. It identifies sequences of candles with low volume activity and marks key price levels that could act as "bounce zones", where price is likely to react.
🔍 How It Works
Volume Analysis:
The indicator calculates a Simple Moving Average (SMA) of volume (default: 20 periods).
It looks for at least 6 consecutive candles (configurable) where the volume is below this volume SMA.
Color Consistency:
The candles must all be of the same color:
Green candles (bullish) for potential downward bounce zones.
Red candles (bearish) for potential upward bounce zones.
Zone Detection:
When a valid sequence is found:
For green candles: it draws a horizontal line at the low of the last red candle before the sequence.
For red candles: it draws a horizontal line at the high of the last green candle before the sequence.
Bounce Tracking:
Each horizontal line remains on the chart until it is touched twice by price (high or low depending on direction).
After two touches, the line is automatically removed, indicating the zone has fulfilled its purpose.
📈 Use Cases
Identify areas of price exhaustion after strong directional pushes.
Spot liquidity zones where institutions might step in.
Combine with candlestick confirmation for reversal trades.
Useful in both trending and range-bound markets for entry or exit signals.
⚙️ Parameters
min_consecutive: Minimum number of consecutive low-volume candles of the same color (default: 6).
vol_ma_len: Length of the volume moving average (default: 20).
🧠 Notes
The indicator does not repaint and is based purely on historical candle and volume structure.
Designed for manual strategy confirmation or support for algorithmic setups.
開源腳本
秉持TradingView一貫精神,這個腳本的創作者將其設為開源,以便交易者檢視並驗證其功能。向作者致敬!您可以免費使用此腳本,但請注意,重新發佈代碼需遵守我們的社群規範。
免責聲明
這些資訊和出版物並非旨在提供,也不構成TradingView提供或認可的任何形式的財務、投資、交易或其他類型的建議或推薦。請閱讀使用條款以了解更多資訊。
開源腳本
秉持TradingView一貫精神,這個腳本的創作者將其設為開源,以便交易者檢視並驗證其功能。向作者致敬!您可以免費使用此腳本,但請注意,重新發佈代碼需遵守我們的社群規範。
免責聲明
這些資訊和出版物並非旨在提供,也不構成TradingView提供或認可的任何形式的財務、投資、交易或其他類型的建議或推薦。請閱讀使用條款以了解更多資訊。