OPEN-SOURCE SCRIPT
RSI-EMA Signal by stock shooter
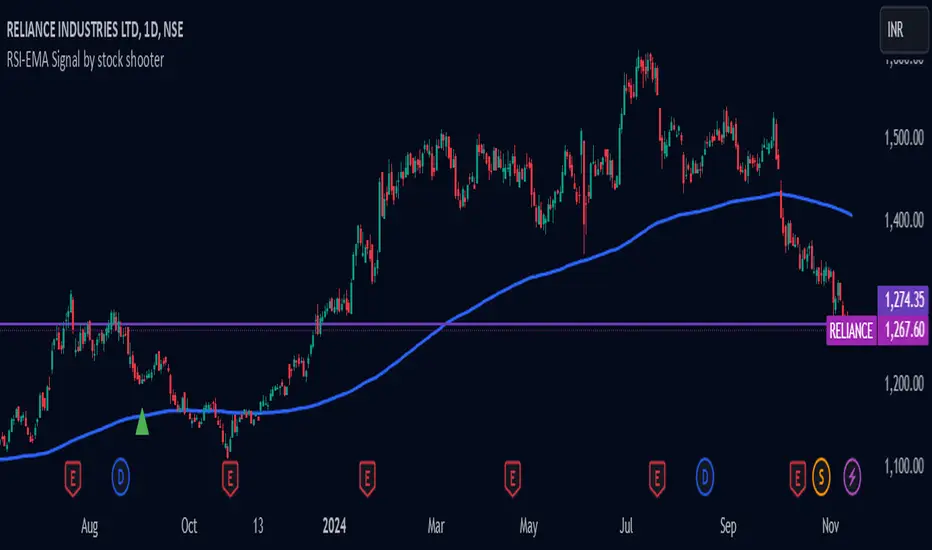
## Strategy Description: 200 EMA Crossover with RSI, Green/Red Candles, Volume, and Exit Conditions
This strategy combines several technical indicators to identify potential long and short entry opportunities in a trading instrument. Here's a breakdown of its components:
1. 200-period Exponential Moving Average (EMA):
* The 200-period EMA acts as a long-term trend indicator.
* The strategy looks for entries when the price is above (long) or below (short) the 200 EMA.
2. Relative Strength Index (RSI):
* The RSI measures the momentum of price movements and helps identify overbought and oversold conditions.
* The strategy looks for entries when the RSI is below 40 (oversold) for long positions and above 60 (overbought) for short positions.
3. Green/Red Candles:
* This indicator filters out potential entries based on the current candle's closing price relative to its opening price.
* The strategy only considers long entries on green candles (closing price higher than opening) and short entries on red candles (closing price lower than opening).
4. Volume:
* This indicator adds a volume filter to the entry conditions.
* The strategy only considers entries when the current candle's volume is higher than the average volume of the previous 20 candles, aiming for stronger signals.
Overall:
This strategy aims to capture long opportunities during potential uptrends and short opportunities during downtrends, based on a combination of price action, momentum, and volume confirmation.
Important Notes:
Backtesting is crucial to evaluate the historical performance of this strategy before deploying it with real capital.
Consider incorporating additional risk management techniques like stop-loss orders.
This strategy is just a starting point and can be further customized based on your trading goals and risk tolerance.
開源腳本
秉持TradingView一貫精神,這個腳本的創作者將其設為開源,以便交易者檢視並驗證其功能。向作者致敬!您可以免費使用此腳本,但請注意,重新發佈代碼需遵守我們的社群規範。
免責聲明
這些資訊和出版物並非旨在提供,也不構成TradingView提供或認可的任何形式的財務、投資、交易或其他類型的建議或推薦。請閱讀使用條款以了解更多資訊。
開源腳本
秉持TradingView一貫精神,這個腳本的創作者將其設為開源,以便交易者檢視並驗證其功能。向作者致敬!您可以免費使用此腳本,但請注意,重新發佈代碼需遵守我們的社群規範。
免責聲明
這些資訊和出版物並非旨在提供,也不構成TradingView提供或認可的任何形式的財務、投資、交易或其他類型的建議或推薦。請閱讀使用條款以了解更多資訊。