OPEN-SOURCE SCRIPT
RShar Liquidity Zone Identifier
Description of the Liquidity Zone Identifier Indicator
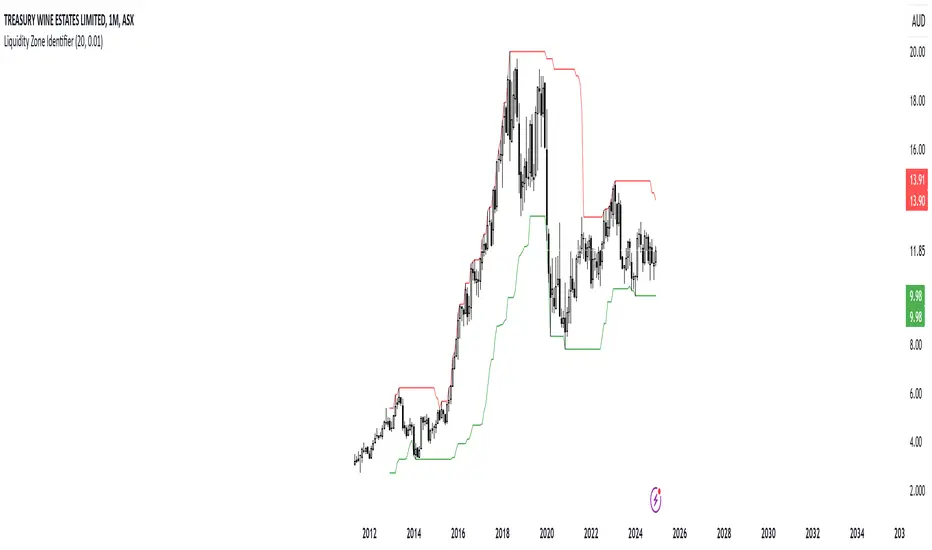
The **Liquidity Zone Identifier** is a TradingView indicator designed to highlight key liquidity zones on a price chart. Liquidity zones represent areas where the price is likely to encounter significant resistance or support, making them critical for technical analysis and trading decisions.
Key Features:
1. **Dynamic Resistance and Support Levels**:
- The indicator calculates the highest high and lowest low over a user-defined period (`length`) to identify potential resistance and support levels.
- Sensitivity can be adjusted using the `zoneSensitivity` parameter, which defines a percentage buffer around these levels to expand the zones.
2. **Visual Representation**:
- Resistance zones are highlighted in **red**, indicating areas where the price may face selling pressure.
- Support zones are highlighted in **green**, representing areas where the price may find buying interest.
- The zones are displayed as shaded regions using the `fill` function, making them visually distinct and easy to interpret.
3. **Customizable Inputs**:
- **Zone Length** (`length`): Determines the number of candles considered for calculating highs and lows.
- **Zone Sensitivity** (`zoneSensitivity`): Sets the percentage margin around the calculated levels to define the liquidity zones.
- **Zone Colors**: Users can customize the colors for resistance and support zones to suit their preferences.
- **Toggle Fill**: The `showFill` option allows users to enable or disable shaded zone visualization.
4. **Alerts for Trading Opportunities**:
- Alerts are triggered when:
- The price enters the **resistance zone** (current high is greater than or equal to the resistance zone).
- The price enters the **support zone** (current low is less than or equal to the support zone).
- These alerts help traders stay informed of critical market movements without constantly monitoring the chart.
#### How It Works:
1. **Calculation of Zones**:
- The highest high and lowest low over the specified `length` are calculated to define the primary levels.
- A buffer zone is added around these levels based on the `zoneSensitivity` percentage, creating a margin of interaction for price movements.
2. **Plotting the Zones**:
- The top and bottom boundaries of the resistance and support zones are plotted as lines.
- The area between these boundaries is shaded using the `fill` function to enhance visualization.
3. **Alerts for Key Events**:
- Traders are notified when price action interacts with the zones, enabling quick decision-making.
#### Use Case:
The Liquidity Zone Identifier is ideal for:
- Identifying areas of potential price reversal or consolidation.
- Spotting high-probability trading setups near resistance and support zones.
- Complementing other technical indicators in a trading strategy.
By effectively highlighting critical price levels, this indicator provides traders with a powerful tool to navigate the markets with greater precision.
開源腳本
秉持TradingView一貫精神,這個腳本的創作者將其設為開源,以便交易者檢視並驗證其功能。向作者致敬!您可以免費使用此腳本,但請注意,重新發佈代碼需遵守我們的社群規範。
免責聲明
這些資訊和出版物並非旨在提供,也不構成TradingView提供或認可的任何形式的財務、投資、交易或其他類型的建議或推薦。請閱讀使用條款以了解更多資訊。
開源腳本
秉持TradingView一貫精神,這個腳本的創作者將其設為開源,以便交易者檢視並驗證其功能。向作者致敬!您可以免費使用此腳本,但請注意,重新發佈代碼需遵守我們的社群規範。
免責聲明
這些資訊和出版物並非旨在提供,也不構成TradingView提供或認可的任何形式的財務、投資、交易或其他類型的建議或推薦。請閱讀使用條款以了解更多資訊。