PROTECTED SOURCE SCRIPT
ATR + Fibs
Description:
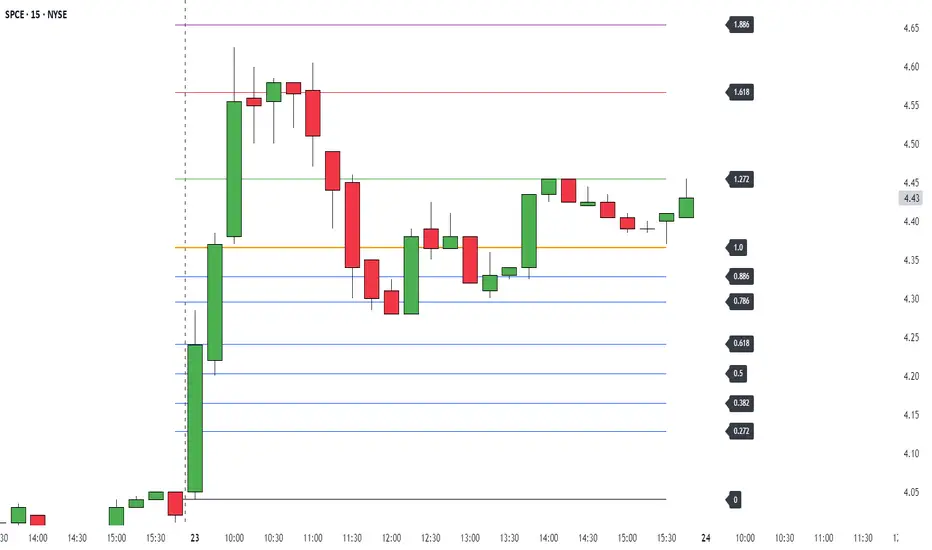
This script plots ATR levels and ATR-based Fibonacci extension levels from either the Low of Day, or High of Day, using the daily Average True Range (ATR) to project key price zones. It's designed to help traders quickly assess where price is trading relative to the day’s ATR.
Features:
Visual reference for how far price has moved relative to today's ATR
Projects fib levels using daily ATR from LOD or HOD
Optional display of fib lines, % labels, and price values
Customizable colors and line widths per level
Auto-resets daily with updated highs/lows
Works on all intraday and higher timeframes
Ideal for traders who want to gauge intraday extension, or frame entries using volatility-based levels.
受保護腳本
此腳本以閉源形式發佈。 不過,您可以自由使用,沒有任何限制 — 點擊此處了解更多。
免責聲明
這些資訊和出版物並非旨在提供,也不構成TradingView提供或認可的任何形式的財務、投資、交易或其他類型的建議或推薦。請閱讀使用條款以了解更多資訊。
受保護腳本
此腳本以閉源形式發佈。 不過,您可以自由使用,沒有任何限制 — 點擊此處了解更多。
免責聲明
這些資訊和出版物並非旨在提供,也不構成TradingView提供或認可的任何形式的財務、投資、交易或其他類型的建議或推薦。請閱讀使用條款以了解更多資訊。