OPEN-SOURCE SCRIPT
已更新 Fiyat - 55 EMA Uzaklık Sinyali
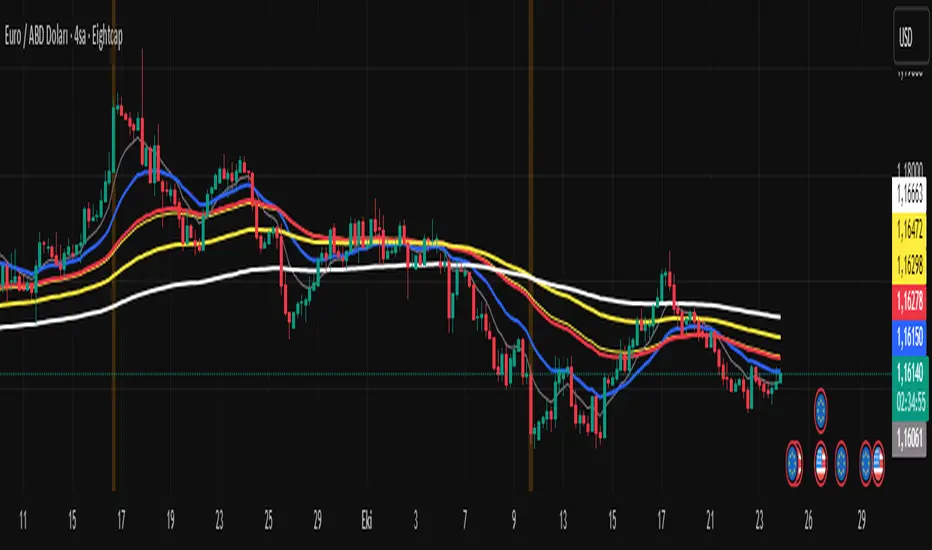
This indicator generates a signal when the price moves a certain percentage away from the 55-period Exponential Moving Average (EMA).
It helps traders identify when the market is stretched too far from its mean level, which can indicate potential reversal or continuation zones.
⚙️ How It Works
Calculates the 55 EMA on the selected chart.
Measures the percentage distance between the current price and the 55 EMA.
When the price distance exceeds the user-defined threshold (default: 0.50%), a visual signal (orange triangle) appears on the chart.
The background also highlights the signal candle.
🧩 Inputs
EMA Length: Default = 55 (can be changed).
Distance Threshold (%): Default = 0.50 → Change to detect stronger or weaker price deviations.
發行說明
This script creates a unified trading signal based on the distance between the white and red lines (no yellow line involved).The white line represents the short-term slope of your moving average.
The red line is a slower moving average of that slope.
When the distance between these two lines becomes greater than a user-defined threshold, a green signal appears.
Both buy and sell signals are displayed in the same color (green) — the color only indicates that a significant distance has been reached, not the direction.
開源腳本
秉持TradingView一貫精神,這個腳本的創作者將其設為開源,以便交易者檢視並驗證其功能。向作者致敬!您可以免費使用此腳本,但請注意,重新發佈代碼需遵守我們的社群規範。
免責聲明
這些資訊和出版物並非旨在提供,也不構成TradingView提供或認可的任何形式的財務、投資、交易或其他類型的建議或推薦。請閱讀使用條款以了解更多資訊。
開源腳本
秉持TradingView一貫精神,這個腳本的創作者將其設為開源,以便交易者檢視並驗證其功能。向作者致敬!您可以免費使用此腳本,但請注意,重新發佈代碼需遵守我們的社群規範。
免責聲明
這些資訊和出版物並非旨在提供,也不構成TradingView提供或認可的任何形式的財務、投資、交易或其他類型的建議或推薦。請閱讀使用條款以了解更多資訊。