INVITE-ONLY SCRIPT
VPBar‴ | Volume & Volatility Power Bar‴
What does it do?
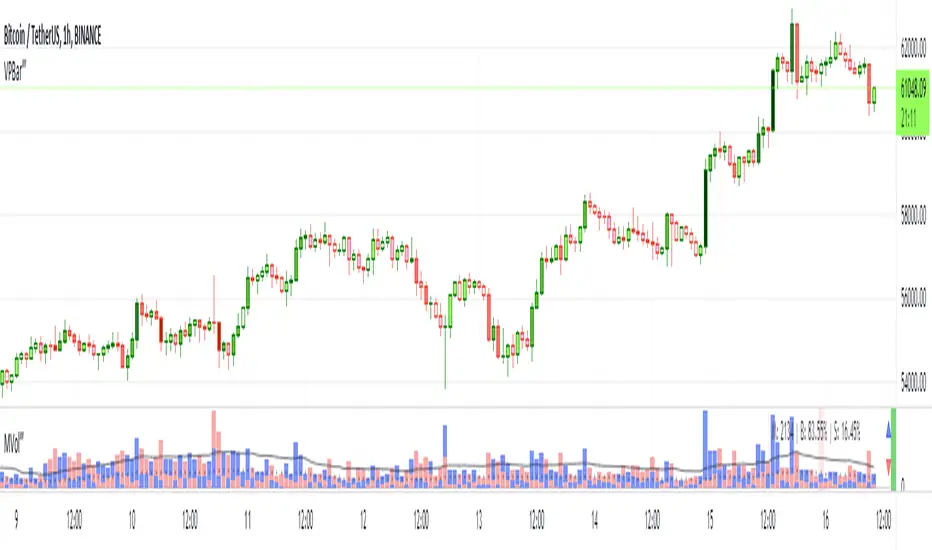
Draws the volume demand into the candlestick in order for you to identify the volume power in during candle formation.
How does it work?
Super easy. It's not too obvious how the volume power affects the market movement by just looking at the volume bars. This indicator transfere to the candlesticks the volume power demand which helps the trader understand the more/less probability of the market moving foward or reverting.
What's my filling?
Gives you a quick perception of the lastes market demand over the market movement. It makes total sence seeing the volume in such a very obvious format.
Indicator features:
- Volume Power (1): green and red gradient volume power (5 green gradients and 5 red gradients)
- Volume Power (2): market standard gradient for positive and negative candles (only 5 colors for both market directions - doesn't help allot, reason why I created this indicator)
- Trend Color Bar: let the candlesticks show you the trend and its reversal
- Momentum Power: besides to the above features, you can add a momentum power indicator with arrow and/or moving average lines crossing
To have access to this indicator, please DM me.
Don't contact me in the comment area.
僅限邀請腳本
僅限作者授權的用戶訪問此腳本,並且通常需要付費。您可以將其增加到收藏腳本中,但是只有在向作者請求並獲得許可之後,才能使用它。 請聯繫MarceloTorres以了解更多信息,或按照下面作者的說明進行操作。
TradingView 不建議購買並使用此腳本,除非您 100% 信任其作者並了解腳本的工作原理。在許多情況下,您可以在我們的社群腳本中免費找到良好的開源替代方案。
作者的說明
″To have access to this indicator, please DM me.
Don't contact me in the comment area.
想在圖表上使用此腳本?
警告:請閱讀,然後再請求訪問權限。
TRADEWISER | Marcelo Torres
marcelo@tradewiser.pro
Vídeo-Análise completa diária no YouTube:
youtube.com/c/TradeWiserPro
Curso/AE
CursoAE.TradeWiser.pro
@TradeWiserPro
Telegram, Twitter, Facebook, LinkedIn, Instagram
marcelo@tradewiser.pro
Vídeo-Análise completa diária no YouTube:
youtube.com/c/TradeWiserPro
Curso/AE
CursoAE.TradeWiser.pro
@TradeWiserPro
Telegram, Twitter, Facebook, LinkedIn, Instagram
免責聲明
這些資訊和出版物並不意味著也不構成TradingView提供或認可的金融、投資、交易或其他類型的意見或建議。請在使用條款閱讀更多資訊。