OPEN-SOURCE SCRIPT
RSI 25 + MA 100+Stoch(sma,bb,ema) - by: rpalconit
Hello everyone,
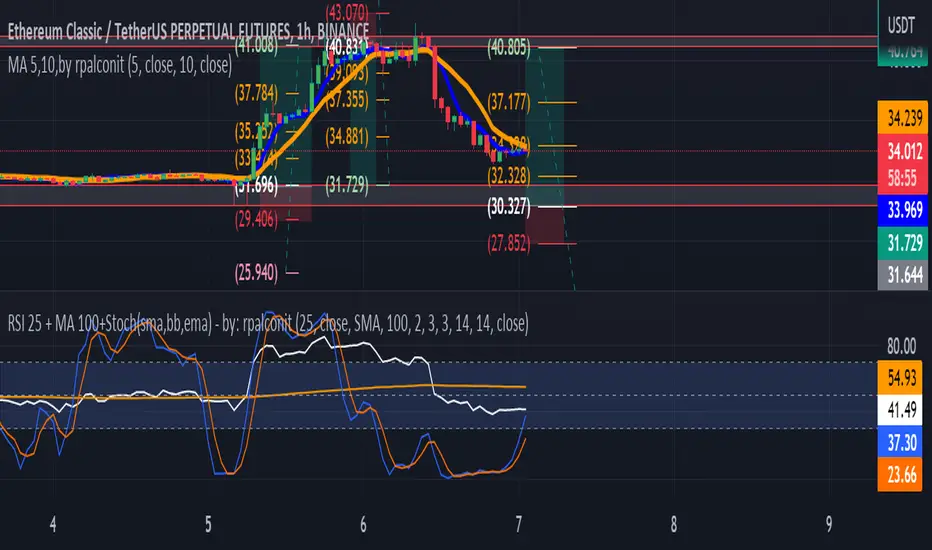
This indicator uses RSI 25 + MA 100 + Stoch(sma,bb,ema to show buy and sell signals.
Signal Features:
• Buy Signal: It gives a buy signal when the RSI Length 25 bend upward below middle/lower bands and crosses MA 100 .
• Sell Signal: It gives a buy signal when the RSI Length 25 bend downward above middle/upper bands and crosses MA 100 .
• .
• Strong Buy Signal: It gives a strong buy signal when the RSI Length 25 bend upward below lower band and within overbought area of 30
• Storng Sell Signal: It gives a strong sell signal when the RSI Length 25 bend downward below lower band and within oversold area of 70.
You can change RSI length in any of your preference. And the Moving average you can select them from the list such as Simple Moving Average(SMA), Bollinger Bands( BB)and Exponential Moving Average (EMA.
In addition it includes momentum indicator like Stochastic RSI for more confirmation.
Details about the indicator
INPUTS
Time Frame
• Time Frames Chart: You can select your preferred timeframe at the dropdown list.
Relative Strength Index Settings
RSI Length: You can choose your preferred RSI length at the dropdown list.
RSI Source: You can choose your preferred RSI source at the dropdown list.
MA Setting:
1. MA Type: You can choose your preferred MA Type at the dropdown list.
2. MA Length: You can choose your preferred MA Length at the dropdown list.
3. stdDiv: You can choose your preferred the dropdown list.
Stochastic RSI gives you an idea about momentum if reach to the oversold and overbought areas.
Best regards,
ruelpalconit
開源腳本
秉持TradingView一貫精神,這個腳本的創作者將其設為開源,以便交易者檢視並驗證其功能。向作者致敬!您可以免費使用此腳本,但請注意,重新發佈代碼需遵守我們的社群規範。
免責聲明
這些資訊和出版物並非旨在提供,也不構成TradingView提供或認可的任何形式的財務、投資、交易或其他類型的建議或推薦。請閱讀使用條款以了解更多資訊。
開源腳本
秉持TradingView一貫精神,這個腳本的創作者將其設為開源,以便交易者檢視並驗證其功能。向作者致敬!您可以免費使用此腳本,但請注意,重新發佈代碼需遵守我們的社群規範。
免責聲明
這些資訊和出版物並非旨在提供,也不構成TradingView提供或認可的任何形式的財務、投資、交易或其他類型的建議或推薦。請閱讀使用條款以了解更多資訊。