OPEN-SOURCE SCRIPT
已更新 Opening Range Breakout Cloud Indicator by TenAMTrader
Opening Range Breakout Cloud Indicator – by TenAMTrader
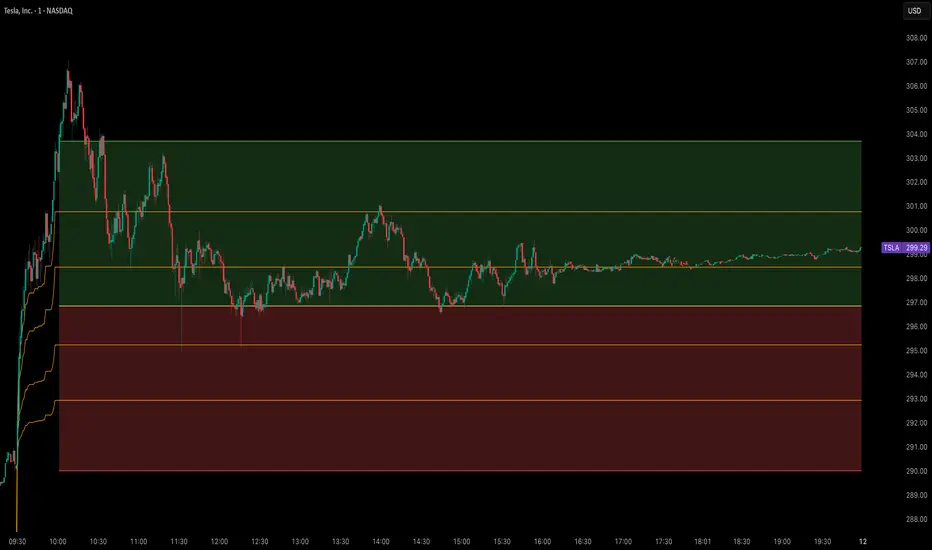
This indicator visually maps out the Opening Range of the trading day — the price high and low between a configurable start and end time (default: 9:30 AM–10:00 AM EST). It helps traders identify breakout levels, key intraday zones, and price behavior relative to the early range.
🔹 What It Shows:
Opening High, Low, and Midpoint lines for each day.
Clouds between the midpoint and high/low for visual clarity.
Optional Second Range (e.g., 9:30–9:45 AM) for more aggressive early signals.
Historical Ranges are preserved, allowing you to view previous days' levels on the chart.
Custom Alerts when price crosses the Opening High, Low, or Midpoint.
Full customization: colors, range times, and display toggles.
🔔 Use It For:
Spotting breakouts or rejections at key levels.
Finding early support/resistance zones.
Planning trades using intraday structure.
⚠️ Use this tool as part of a broader trading strategy. No indicator guarantees results — always trade at your own discretion.
發行說明
Opening Range Breakout (ORB) Cloud Indicator with AlertsThis custom indicator helps identify potential breakouts by plotting the Opening Range (ORB) during a specific time period each trading day. It tracks the highest and lowest prices within the defined session and plots them along with the midpoint. The indicator also features a cloud between the ORB high, low, and midpoint, making it easier to visualize price action.
Key Features:
Custom Time Range: Set the start and end times of your preferred opening range.
ORB Levels: Displays the ORB High, ORB Low, and ORB Midpoint.
Cloud Visualization: A shaded cloud between the high/mid and low/mid for better clarity.
Alerts: Get notified when the price crosses the ORB High, ORB Low, or the ORB Midpoint.
How It Helps:
Track price action during the opening range.
Identify breakouts above or below key levels.
Visualize market sentiment with the cloud.
Legal Disclaimer:
This indicator is provided for educational purposes only. It is not financial advice and should not be considered as a recommendation to buy or sell any securities. The use of this indicator is at your own risk. The creator is not responsible for any losses or damages that may occur from using this tool. Always do your own research and consult a professional before making any investment decisions.
發行說明
Opening Range Breakout (ORB) Cloud Indicator with Alerts and Fibonacci LevelsThis custom Opening Range Breakout (ORB) indicator is designed to help traders visualize key levels during the market's opening range and identify potential breakouts. It calculates the ORB High, ORB Low, and ORB Midpoint within a user-defined time range, and then plots them along with a shaded cloud for better clarity.
Additionally, this indicator now includes Fibonacci Golden Pocket Levels (0.786, 0.618, 0.382, 0.214) based on the ORB High and Low. These levels are commonly used for retracement and support/resistance analysis. You can toggle the visibility of these Fibonacci levels based on your preference.
Key Features:
Custom Time Range: Set the start and end times of your preferred opening range.
ORB Levels: Displays the ORB High, ORB Low, and ORB Midpoint.
Cloud Visualization: Shaded cloud between the high/mid and low/mid for easier price action analysis.
Fibonacci Levels: Optionally plots Fibonacci Golden Pocket Levels (0.786, 0.618, 0.382, 0.214) based on the ORB High and Low.
Alerts: Get notified when the price crosses the ORB High, ORB Low, or ORB Midpoint.
Fibonacci Visibility Toggle: You can choose to show or hide the Fibonacci levels via the input settings.
How It Helps:
Track Price Action: Visualize key levels from the market's opening range and identify potential breakouts.
Fibonacci Levels: Use the Fibonacci levels to spot retracements and areas of support or resistance.
Market Sentiment: Easily assess if price is trending above or below significant levels.
Legal Disclaimer:
This indicator is provided for educational purposes only. It is not financial advice and should not be considered as a recommendation to buy or sell any securities. The use of this indicator is at your own risk. The creator is not responsible for any losses or damages that may occur from using this tool. Always do your own research and consult a professional before making any investment decisions.
發行說明
ORB Cloud Indicator with Golden Fib Pockets and AlertsThe ORB Cloud Indicator helps you track the Opening Range Breakout (ORB) levels for the market's initial period. It plots the ORB High, Low, and Midpoint with an optional cloud fill, and includes Fibonacci levels for additional insights. You can set alerts to notify you when the price crosses any of these key levels.
Features:
*Plots ORB High, Low, and Midpoint.
*Optional Fibonacci levels (0.786, 0.618, 0.382, 0.214).
*Customizable time range for ORB calculation.
*Alerts for price crossing the ORB High, Low, or Midpoint (with toggle options).
*Color customization for all levels.
Legal Disclaimer:
This indicator is for educational purposes only and should not be considered financial advice. Trading involves risk, and the creator is not responsible for any financial losses. Use this script at your own risk and conduct your own research before making trading decisions. Always consult a financial advisor if needed.
開源腳本
秉持TradingView一貫精神,這個腳本的創作者將其設為開源,以便交易者檢視並驗證其功能。向作者致敬!您可以免費使用此腳本,但請注意,重新發佈代碼需遵守我們的社群規範。
免責聲明
這些資訊和出版物並非旨在提供,也不構成TradingView提供或認可的任何形式的財務、投資、交易或其他類型的建議或推薦。請閱讀使用條款以了解更多資訊。
開源腳本
秉持TradingView一貫精神,這個腳本的創作者將其設為開源,以便交易者檢視並驗證其功能。向作者致敬!您可以免費使用此腳本,但請注意,重新發佈代碼需遵守我們的社群規範。
免責聲明
這些資訊和出版物並非旨在提供,也不構成TradingView提供或認可的任何形式的財務、投資、交易或其他類型的建議或推薦。請閱讀使用條款以了解更多資訊。