OPEN-SOURCE SCRIPT
Pullback Warning
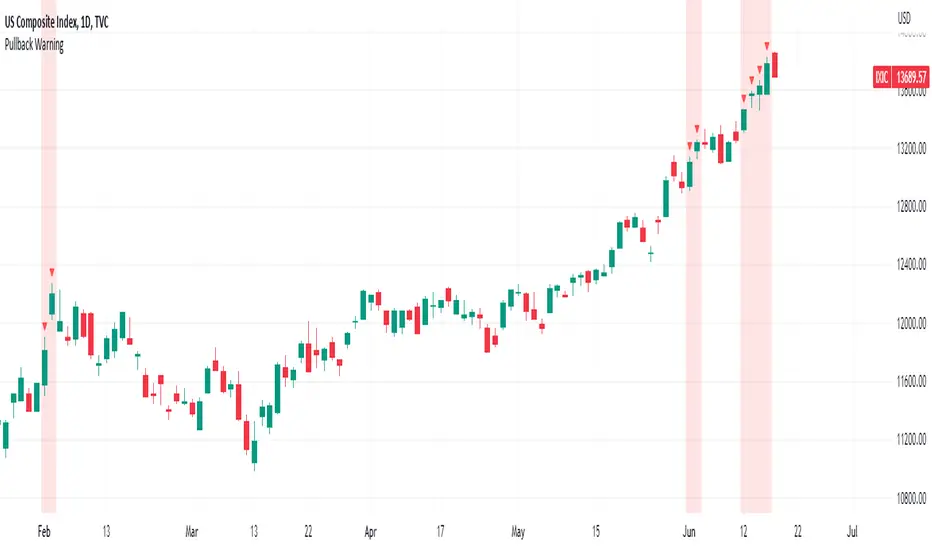
The Pullback Warning indicator is a simple indicator that highlights the potential for a market pullback, by measuring distances between certain key moving averages.
John Pocorobba recently shared in his general market updates, research showing that when the distance between the closing price and the 9 day exponential moving average is greater than the distance between the 9 day exponential moving average and the 20 day exponential moving average a pullback is likely.
While this condition occurs frequently, I added sensitivity options to try and filter out the noise. The sensitivity is based on the closing price’s extension from the 50 day simple moving average. Depending on your level of sensitivity, only signals that occur when price is extended either 5, 6, or 7 percent away from the 50 sma will be plotted.
Choose how to see the signal:
Note this signal works best on indexes, not individual securities.
John Pocorobba recently shared in his general market updates, research showing that when the distance between the closing price and the 9 day exponential moving average is greater than the distance between the 9 day exponential moving average and the 20 day exponential moving average a pullback is likely.
While this condition occurs frequently, I added sensitivity options to try and filter out the noise. The sensitivity is based on the closing price’s extension from the 50 day simple moving average. Depending on your level of sensitivity, only signals that occur when price is extended either 5, 6, or 7 percent away from the 50 sma will be plotted.
Choose how to see the signal:
- Highlight Background
- Plot a symbol at desired location
Note this signal works best on indexes, not individual securities.
開源腳本
秉持TradingView一貫精神,這個腳本的創作者將其設為開源,以便交易者檢視並驗證其功能。向作者致敬!您可以免費使用此腳本,但請注意,重新發佈代碼需遵守我們的社群規範。
Trusted Pine programmer. Send me a message for script development.
免責聲明
這些資訊和出版物並非旨在提供,也不構成TradingView提供或認可的任何形式的財務、投資、交易或其他類型的建議或推薦。請閱讀使用條款以了解更多資訊。
開源腳本
秉持TradingView一貫精神,這個腳本的創作者將其設為開源,以便交易者檢視並驗證其功能。向作者致敬!您可以免費使用此腳本,但請注意,重新發佈代碼需遵守我們的社群規範。
Trusted Pine programmer. Send me a message for script development.
免責聲明
這些資訊和出版物並非旨在提供,也不構成TradingView提供或認可的任何形式的財務、投資、交易或其他類型的建議或推薦。請閱讀使用條款以了解更多資訊。