OPEN-SOURCE SCRIPT
ADX + DMI with Fill and Crossover
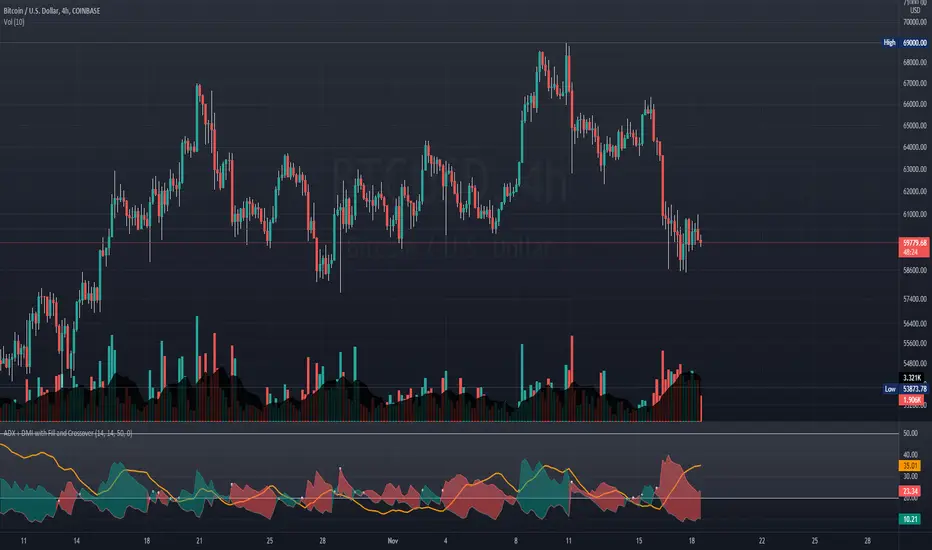
Better visuals for the ADX/DMI technical indicator.
I filled the DI+ and DI- with color to easily track the trend. Also, I added shapes (+) / (x) once the DI+ and DI- crossover each other.
You can also set two horizontal lines so you can easily track where the ADX value is at.
I filled the DI+ and DI- with color to easily track the trend. Also, I added shapes (+) / (x) once the DI+ and DI- crossover each other.
You can also set two horizontal lines so you can easily track where the ADX value is at.
開源腳本
秉持TradingView一貫精神,這個腳本的創作者將其設為開源,以便交易者檢視並驗證其功能。向作者致敬!您可以免費使用此腳本,但請注意,重新發佈代碼需遵守我們的社群規範。
免責聲明
這些資訊和出版物並非旨在提供,也不構成TradingView提供或認可的任何形式的財務、投資、交易或其他類型的建議或推薦。請閱讀使用條款以了解更多資訊。
開源腳本
秉持TradingView一貫精神,這個腳本的創作者將其設為開源,以便交易者檢視並驗證其功能。向作者致敬!您可以免費使用此腳本,但請注意,重新發佈代碼需遵守我們的社群規範。
免責聲明
這些資訊和出版物並非旨在提供,也不構成TradingView提供或認可的任何形式的財務、投資、交易或其他類型的建議或推薦。請閱讀使用條款以了解更多資訊。