OPEN-SOURCE SCRIPT
已更新 ATAI Triangles — Volume-Based & Price Pattern Analysis (v1.01)
ATAI Triangles — Volume-Based & Price Pattern Analysis (v1.01)
Overview
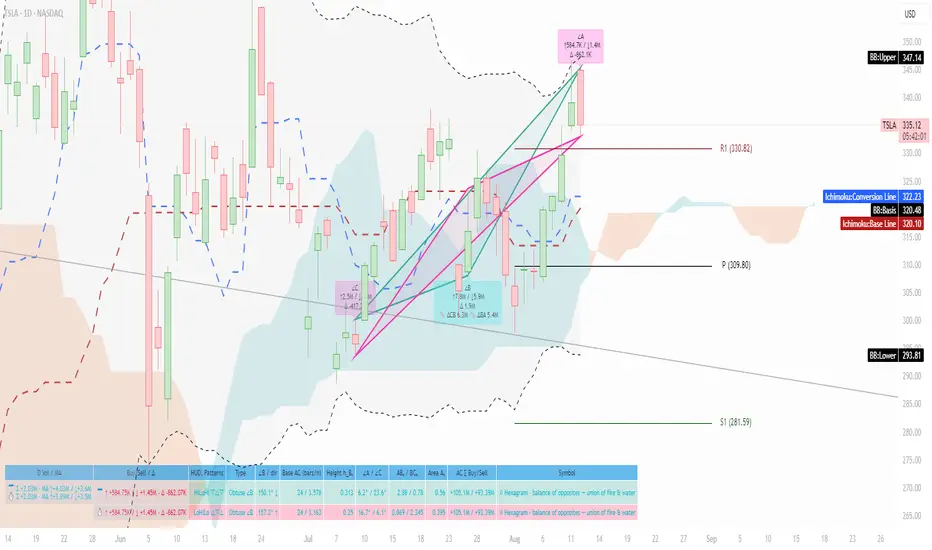
ATAI Triangles identifies two synchronized triangle structures — Hi-Lo-Hi (HLH) and Lo-Hi-Lo (LHL) — and analyzes them both geometrically and volumetrically. For each triangle, volume is split between its two legs (segments), providing interpretable insights into buyer vs seller activity along each path.
The idea is that certain geometric shapes, when paired with volume distribution on each leg, can reveal patterns worth exploring. Users are encouraged to share their observations and interpretations in the TradingView comments section so that more aspects of these triangle combinations can be discovered collectively.
Extra (for fun)
For a bit of entertainment, we’ve included a symbolic “hexagram” glyph that appears when both triangle types align in a particular way — it’s just a visual nod to geometry and has no predictive or trading value.

Interface & data clarity
- Inputs and parameters are organized by function (pattern geometry, volume analysis, visuals, HUD, labels).
- Each input includes tooltips explaining its purpose, units, and possible effects on calculations.
- All on-chart objects (polylines, labels, connectors) are named and colored to reflect their role, with volume values formatted in engineering notation (K, M, B).
- HUD columns and label texts use concise terms and consistent units, so that every displayed value is directly traceable to a calculation in the code.
- Daily and lower-timeframe volume series are clearly separated, with update logic documented to indicate intrabar provisional values vs finalized bar-close values.
Usage notes
Designed to be used alongside other indicators and chart tools for context; it is not a standalone signal generator.
All Buy/Sell volumes are absolute (non-negative); Δ = Buy − Sell.
Intrabar values update live and finalize at bar close (no repaint after close).
Disclaimer
For research, discussion, and educational purposes only. This is not financial advice and does not guarantee any outcome. Trade at your own risk.
Overview
ATAI Triangles identifies two synchronized triangle structures — Hi-Lo-Hi (HLH) and Lo-Hi-Lo (LHL) — and analyzes them both geometrically and volumetrically. For each triangle, volume is split between its two legs (segments), providing interpretable insights into buyer vs seller activity along each path.
The idea is that certain geometric shapes, when paired with volume distribution on each leg, can reveal patterns worth exploring. Users are encouraged to share their observations and interpretations in the TradingView comments section so that more aspects of these triangle combinations can be discovered collectively.
Extra (for fun)
For a bit of entertainment, we’ve included a symbolic “hexagram” glyph that appears when both triangle types align in a particular way — it’s just a visual nod to geometry and has no predictive or trading value.
Interface & data clarity
- Inputs and parameters are organized by function (pattern geometry, volume analysis, visuals, HUD, labels).
- Each input includes tooltips explaining its purpose, units, and possible effects on calculations.
- All on-chart objects (polylines, labels, connectors) are named and colored to reflect their role, with volume values formatted in engineering notation (K, M, B).
- HUD columns and label texts use concise terms and consistent units, so that every displayed value is directly traceable to a calculation in the code.
- Daily and lower-timeframe volume series are clearly separated, with update logic documented to indicate intrabar provisional values vs finalized bar-close values.
Usage notes
Designed to be used alongside other indicators and chart tools for context; it is not a standalone signal generator.
All Buy/Sell volumes are absolute (non-negative); Δ = Buy − Sell.
Intrabar values update live and finalize at bar close (no repaint after close).
Disclaimer
For research, discussion, and educational purposes only. This is not financial advice and does not guarantee any outcome. Trade at your own risk.
發行說明
ATAI Triangles — Volume-Based Price Pattern Analysis v1.01+ (Upgrade)What’s new
- Triangle Quality Gate (robust filtering):
New inputs Min height/base ratio (default 0.08) and Symmetric apex x-mid tol (default 0.12). Triangles must clear a minimum height/base and, for Sym, the B apex must sit near the midpoint of AC on normalized time. Fewer low-quality hits, more reliable geometry.
- Sharper pattern classification:
• Symmetric now requires both ∠A≈∠C and xB≈0.5 (within tolerance).
• Asc/Desc/Sym flags are gated by the Quality Gate—no flimsy triangles pass.
• Right-angle validation tightened (side-based + ~90° angle check) for the “47th Problem” suffix.
Defaults tuned for structure:
HLH/LHL spans increased to 27 bars (from 13). X scale · custom bars default = 27.
Hexagram (Star-of-David) combo — geometry-based:
Rewritten on normalized geometry (no centroid/ATR heuristics). A hexagram appears only when:
- both triangles are Symmetric and non-degenerate,
- AC bases are ~parallel (slope tolerance),
- mirror angles (A_HLH≈C_LHL and C_HLH≈A_LHL),
- similar height and base-length ratios,
- B apex times align (normalized x),
- AC spans overlap within a small bar window, and both triangles pass the Quality Gate.
New inputs: Base slope tol (°), Angle mirror tol (°), Height ratio ≤, Base length ratio ≤, xB alignment tol, Max AC span diff (bars).
HUD shows the hexagram once (no duplicate in LHL row).
HUD / UX polish:
Column color inputs for HLH/LHL, panel default switched to light, cleaner 2-block layout, concise pattern tags (• Asc / • Desc / • Sym). LHL “Under” column prints its own symbol only (no hex fallback).
OB/OS module (kept consistent & documented):
Directional volume spikes (Vol/SMA & Z-Score) gated by a 7-oscillator consensus (RSI, Stoch, %R, CCI, MFI, DeMarker, StochRSI) with a sync window (1–2 bars) and minHits threshold. A label prints only when volume and oscillators converge; reason text lists which indicators hit.
Notes
- Research/educational only; no repaint after bar close.
- All tolerances are user-tunable; defaults aim for clean structure, not over-sensitivity.
- Hexagram is a visual geometry combo, not a predictive signal by itself.
開源腳本
秉持TradingView一貫精神,這個腳本的創作者將其設為開源,以便交易者檢視並驗證其功能。向作者致敬!您可以免費使用此腳本,但請注意,重新發佈代碼需遵守我們的社群規範。
免責聲明
這些資訊和出版物並非旨在提供,也不構成TradingView提供或認可的任何形式的財務、投資、交易或其他類型的建議或推薦。請閱讀使用條款以了解更多資訊。
開源腳本
秉持TradingView一貫精神,這個腳本的創作者將其設為開源,以便交易者檢視並驗證其功能。向作者致敬!您可以免費使用此腳本,但請注意,重新發佈代碼需遵守我們的社群規範。
免責聲明
這些資訊和出版物並非旨在提供,也不構成TradingView提供或認可的任何形式的財務、投資、交易或其他類型的建議或推薦。請閱讀使用條款以了解更多資訊。