OPEN-SOURCE SCRIPT
Rogers & Satchell Volatility Estimation
First off, a huge thank you to the following people:
theheirophant: tradingview.com/u/theheirophant/
alexgrover: tradingview.com/u/alexgrover/
NGBaltic: tradingview.com/u/NGBaltic/
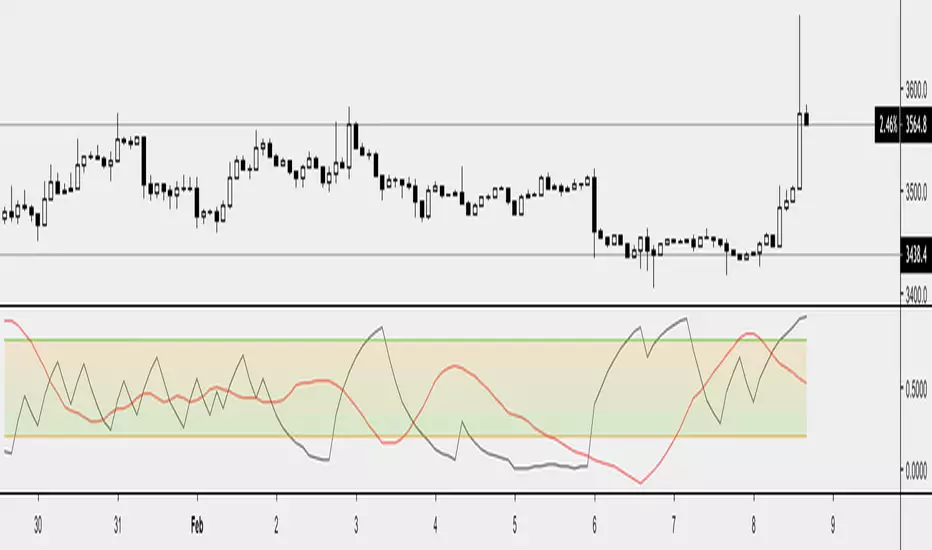
The Rogers & Satchell function is a volatility estimator that outperforms other estimators when the underlying follows a geometric Brownian motion with a drift (historical data mean returns different from zero). As a result, it provides a better volatility estimation when the underlying is trending. However, the Rogers & Satchell estimator does not account for jumps in price (gaps). It assumes no opening jump. The function uses the open, close, high, and low price series in its calculation and it has only one parameter, which is the period to use to estimate the volatility.
This script allows you to transform the volatility reading. The intention of this is to be able to compare volatility across different assets and timeframes. Having a relative reading of volatility also allows you to better gauge volatility within the context of current market conditions.
For the signal lie I chose a repulsion moving average to remove choppy crossovers of the estimator and the signal. This may have been a mistake, so in the near-future I might update so that the MA can be selected. Let me know if you have any opinions either way.
Want to Learn?
If you'd like the opportunity to learn Pine but you have difficulty finding resources to guide you, take a look at this rudimentary list: docs.google.com/document/d/10t3ZCQAd2dpdTGPYXDKk2hAM_BQ1Zm80tk0VGHViQc4/edit?usp=sharing
The list will be updated in the future as more people share the resources that have helped, or continue to help, them. Follow me on Twitter to keep up-to-date with the growing list of resources.
Suggestions or Questions?
Don't even kinda hesitate to forward them to me. My (metaphorical) door is always open.
theheirophant: tradingview.com/u/theheirophant/
alexgrover: tradingview.com/u/alexgrover/
NGBaltic: tradingview.com/u/NGBaltic/
The Rogers & Satchell function is a volatility estimator that outperforms other estimators when the underlying follows a geometric Brownian motion with a drift (historical data mean returns different from zero). As a result, it provides a better volatility estimation when the underlying is trending. However, the Rogers & Satchell estimator does not account for jumps in price (gaps). It assumes no opening jump. The function uses the open, close, high, and low price series in its calculation and it has only one parameter, which is the period to use to estimate the volatility.
This script allows you to transform the volatility reading. The intention of this is to be able to compare volatility across different assets and timeframes. Having a relative reading of volatility also allows you to better gauge volatility within the context of current market conditions.
For the signal lie I chose a repulsion moving average to remove choppy crossovers of the estimator and the signal. This may have been a mistake, so in the near-future I might update so that the MA can be selected. Let me know if you have any opinions either way.
Want to Learn?
If you'd like the opportunity to learn Pine but you have difficulty finding resources to guide you, take a look at this rudimentary list: docs.google.com/document/d/10t3ZCQAd2dpdTGPYXDKk2hAM_BQ1Zm80tk0VGHViQc4/edit?usp=sharing
The list will be updated in the future as more people share the resources that have helped, or continue to help, them. Follow me on Twitter to keep up-to-date with the growing list of resources.
Suggestions or Questions?
Don't even kinda hesitate to forward them to me. My (metaphorical) door is always open.
開源腳本
秉持TradingView一貫精神,這個腳本的創作者將其設為開源,以便交易者檢視並驗證其功能。向作者致敬!您可以免費使用此腳本,但請注意,重新發佈代碼需遵守我們的社群規範。
免責聲明
這些資訊和出版物並非旨在提供,也不構成TradingView提供或認可的任何形式的財務、投資、交易或其他類型的建議或推薦。請閱讀使用條款以了解更多資訊。
開源腳本
秉持TradingView一貫精神,這個腳本的創作者將其設為開源,以便交易者檢視並驗證其功能。向作者致敬!您可以免費使用此腳本,但請注意,重新發佈代碼需遵守我們的社群規範。
免責聲明
這些資訊和出版物並非旨在提供,也不構成TradingView提供或認可的任何形式的財務、投資、交易或其他類型的建議或推薦。請閱讀使用條款以了解更多資訊。