OPEN-SOURCE SCRIPT
Volume Zones Indicator
Volume Zones Indicator — VWAP with Dynamic Monthly Volume Zones
This indicator is an enhanced version of the classic VWAP (Volume Weighted Average Price), designed to create clear monthly zones around VWAP based on average price range (ATR) and volume activity.
The core idea is to highlight key zones where price is more likely to reverse or consolidate, based on where significant trading volume occurs.
How does it work?
VWAP is calculated over the last N days (set by the lookbackPeriod input).
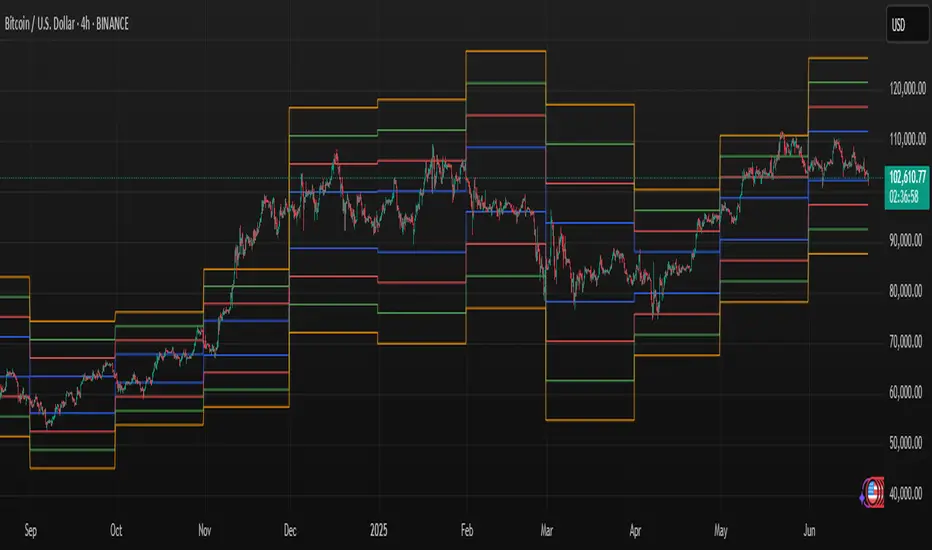
Four zones are plotted above and below VWAP, spaced using a multiple of ATR.
Each zone has its own color for clarity:
Blue — closest to VWAP
Red — second band
Green — third band
Orange — outer band (potential breakout or exhaustion zone)
If the current volume exceeds the moving average of volume, it is highlighted directly on the chart. This helps detect accumulation or distribution moments more easily.
What does the trader see?
You see horizontal colored bands on the chart that update at the start of each new month. These zones:
Remain fixed throughout the month
Automatically adjust based on recent volume and volatility
Act as dynamic support/resistance levels
Best used for:
Mean reversion strategies — identifying pullbacks toward value areas
Support and resistance mapping — automatic SR zones based on price/volume behavior
Breakout filtering — when price reaches zone 3 or 4, trend continuation or reversal is likely
Adding volume context to price action — works well with candlestick and pattern analysis
Settings
Lookback Period (Days): VWAP and volume smoothing length
Volume Area Threshold %: Reserved for future functionality
Works on any timeframe; best suited for 4H timeframe.
Zones are calculated and fixed monthly for clean visual context
Combines price structure with actual volume flow for more reliable decision-making
This indicator is an enhanced version of the classic VWAP (Volume Weighted Average Price), designed to create clear monthly zones around VWAP based on average price range (ATR) and volume activity.
The core idea is to highlight key zones where price is more likely to reverse or consolidate, based on where significant trading volume occurs.
How does it work?
VWAP is calculated over the last N days (set by the lookbackPeriod input).
Four zones are plotted above and below VWAP, spaced using a multiple of ATR.
Each zone has its own color for clarity:
Blue — closest to VWAP
Red — second band
Green — third band
Orange — outer band (potential breakout or exhaustion zone)
If the current volume exceeds the moving average of volume, it is highlighted directly on the chart. This helps detect accumulation or distribution moments more easily.
What does the trader see?
You see horizontal colored bands on the chart that update at the start of each new month. These zones:
Remain fixed throughout the month
Automatically adjust based on recent volume and volatility
Act as dynamic support/resistance levels
Best used for:
Mean reversion strategies — identifying pullbacks toward value areas
Support and resistance mapping — automatic SR zones based on price/volume behavior
Breakout filtering — when price reaches zone 3 or 4, trend continuation or reversal is likely
Adding volume context to price action — works well with candlestick and pattern analysis
Settings
Lookback Period (Days): VWAP and volume smoothing length
Volume Area Threshold %: Reserved for future functionality
Works on any timeframe; best suited for 4H timeframe.
Zones are calculated and fixed monthly for clean visual context
Combines price structure with actual volume flow for more reliable decision-making
開源腳本
秉持TradingView一貫精神,這個腳本的創作者將其設為開源,以便交易者檢視並驗證其功能。向作者致敬!您可以免費使用此腳本,但請注意,重新發佈代碼需遵守我們的社群規範。
免責聲明
這些資訊和出版物並非旨在提供,也不構成TradingView提供或認可的任何形式的財務、投資、交易或其他類型的建議或推薦。請閱讀使用條款以了解更多資訊。
開源腳本
秉持TradingView一貫精神,這個腳本的創作者將其設為開源,以便交易者檢視並驗證其功能。向作者致敬!您可以免費使用此腳本,但請注意,重新發佈代碼需遵守我們的社群規範。
免責聲明
這些資訊和出版物並非旨在提供,也不構成TradingView提供或認可的任何形式的財務、投資、交易或其他類型的建議或推薦。請閱讀使用條款以了解更多資訊。