OPEN-SOURCE SCRIPT
已更新 Overbought/Oversold Bands
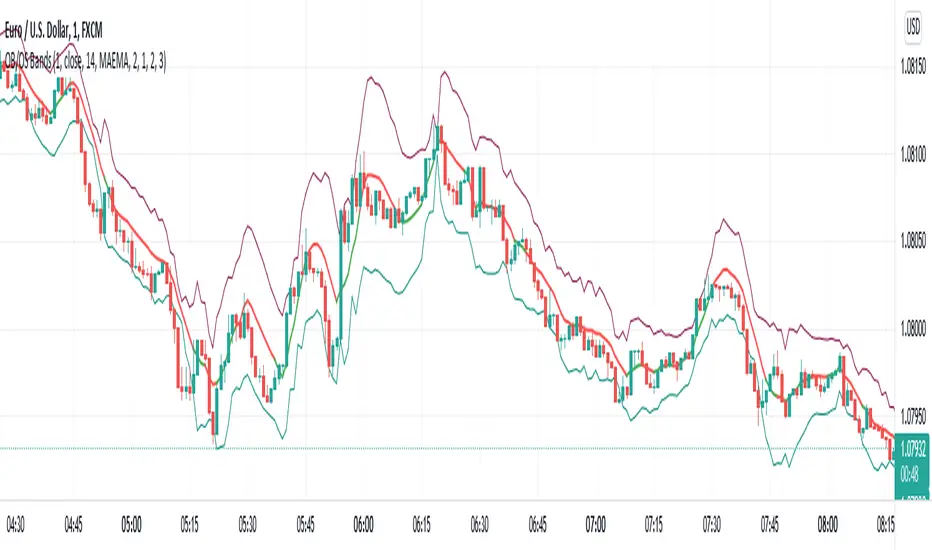
The basis of this script is my "Hybrid Overbought/Oversold Detector" which uses many different oscillators to confirm overbought/oversold conditions. The main idea is to generate higher and lower bands around the desired moving average using an average of the volatility (ATR) and the standard deviation (StDev), of course by interfering detected overbought/oversold condition.
Simply put, the more the asset become overvalued/undervalued, the tighter the channel would be and every breakout of the bands announces a return back into the channel in near future.
By default, the multiplier of the standard deviation in the indicator settings is set to 2 which means only less than 5% of price actions would appear outside the bands. Also the default multiplier of the ATR is set to 3 which leads to some similar result, but to achieve more strict results setting StDev multiplier to 3 and ATR multiplier to 4 would be useful.
The type of the central moving average could be picked up from 6 different types which are:
- SMA (Simple Moving Average)
- EMA (Exponential Moving Average)
- HMA (Hull Moving Average)
- LSMA (Least Squares Moving Average)
- TMA (Triangular Moving Average)
- MAEMA (My Personalized Momentum Adjusted EMA)
The latter one leads to a useful combination of the channel with the momentum.
Also the script has multi-timeframe features and the user could apply calculations from other time frames to the current chart.
Hope the idea would be helpful!
發行說明
- Added an option to change MA line width- Added an option to colorize the MA based on detected trend
發行說明
- Restructured the code & increased overall performance- Converted to Pine v5
- Made indicator settings more user-friendly
- Made OB/OS calculation better
- Fixed some MTF calculation bugs
開源腳本
秉持TradingView一貫精神,這個腳本的創作者將其設為開源,以便交易者檢視並驗證其功能。向作者致敬!您可以免費使用此腳本,但請注意,重新發佈代碼需遵守我們的社群規範。
免責聲明
這些資訊和出版物並非旨在提供,也不構成TradingView提供或認可的任何形式的財務、投資、交易或其他類型的建議或推薦。請閱讀使用條款以了解更多資訊。
開源腳本
秉持TradingView一貫精神,這個腳本的創作者將其設為開源,以便交易者檢視並驗證其功能。向作者致敬!您可以免費使用此腳本,但請注意,重新發佈代碼需遵守我們的社群規範。
免責聲明
這些資訊和出版物並非旨在提供,也不構成TradingView提供或認可的任何形式的財務、投資、交易或其他類型的建議或推薦。請閱讀使用條款以了解更多資訊。