OPEN-SOURCE SCRIPT
已更新 Simple Gap Indicator
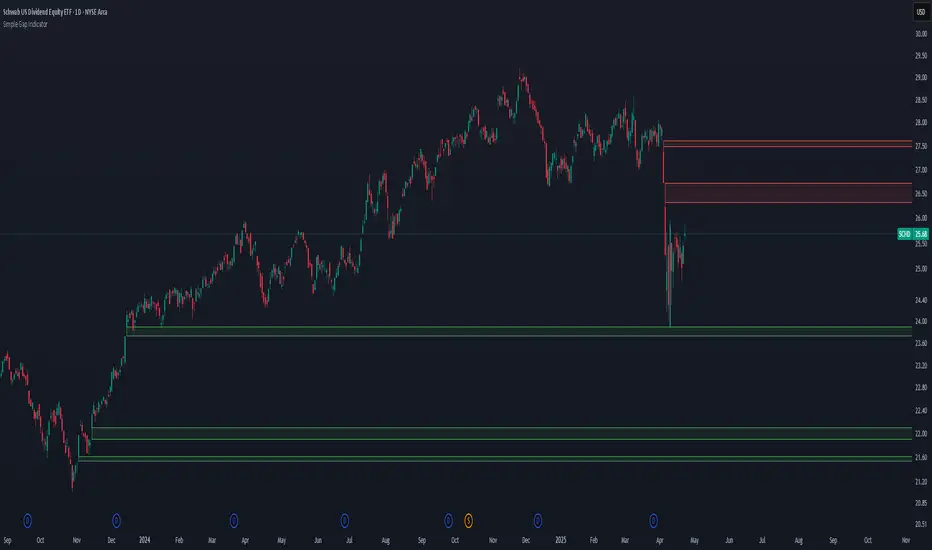
The Simple Gap Indicator is a powerful tool designed to detect and visualize price gaps in the market, helping traders identify key levels of support and resistance. Whether you're analyzing gap-up or gap-down scenarios, this indicator provides clear visual cues to enhance your trading decisions.
Key Features:
Gap Detection: Automatically identifies gap-up and gap-down events based on user-defined sensitivity.
Customizable Display Styles: Choose between lines or boxes to represent gaps visually, depending on your preference.
Extend Options: Control how far the lines or boxes extend on the chart (None, Right, Left, Both).
User-Friendly Inputs: Adjust the number of bars to examine and sensitivity to gap size for precise customization.
Dynamic Visualization:
Gap-Up Events: Highlighted in green for easy identification of bullish gaps.
Gap-Down Events: Highlighted in red for bearish gaps.
發行說明
This TradingView script identifies and visualizes price gaps that occur between consecutive bars, providing traders with a powerful tool to track potential market shifts. It highlights gap-ups and gap-downs where the price difference between two consecutive bars exceeds a user-defined threshold, offering an insightful view into market behavior.Key Features:
Gap Detection: Automatically detects gap-up and gap-down situations by comparing the high and low values of consecutive bars from a custom timeframe.
Gap Sensitivity: Adjust the sensitivity level to determine the minimum size of a gap that should be considered significant. This allows for fine-tuning the detection based on market conditions and asset volatility.
Custom Timeframe Support: Users can define a separate timeframe for gap calculation, helping to identify gaps on different timeframes than the chart itself.
Visual Customization: Choose between two display styles—Lines or Boxes—to represent gaps. Customize gap colors (green for gap-ups, red for gap-downs) to suit your charting preferences.
Extend Option: Extend the gap display to the right, left, or both sides, or choose not to extend for a more compact chart.
Timeframe Mismatch Notification: The script alerts you if the gap's timeframe differs from the chart's timeframe, helping you understand the context of the gaps more clearly.
Ideal For:
Traders looking to spot price gaps on the chart and monitor if they are filled or remain unclosed.
Those who trade around gap-based strategies such as gap-filling or breakout strategies.
Users who prefer fine-tuning the sensitivity and display style of gap indicators.
This script is designed to be a reliable and flexible tool for gap traders, allowing for better gap analysis and a clearer visualization of key market movements.
發行說明
Bug FixFixed an issue with color in box mode. The gap boxes now correctly display color as intended, improving visibility of underlying chart elements.
Additional Notes
No changes were made to the line display mode or other functionalities of the indicator.
Users are encouraged to update to this version for the best visual representation of gaps in box mode.
發行說明
Simple Gap Indicator - Release NotesEnhanced Gap Sensitivity Calculation:
Gap sensitivity calculation is now based on ATR (Average True Range) instead of simple percentage difference, providing a more accurate detection of significant gaps.
User-defined sensitivity threshold (gap_sensitivity) allows fine-tuning the sensitivity level with improved precision.
Transparency Control:
Added option to control gap box transparency (gap_transparency) ranging from 0 (opaque) to 100 (fully transparent).
發行說明
New Feature: Visible Gaps Only🔹 What's New?
Added "Show only gaps starting in visible screen" option
When enabled, the indicator displays only gaps that begin within the current chart view (zoomed/scrolled area).
Default: OFF (shows all gaps historically).
🔹 Why Use It?
✔ Reduces clutter by hiding gaps outside your active analysis range.
✔ Focuses on relevant price levels for tighter decision-making.
發行說明
Improved speed, no functionality changes. 發行說明
minor bug fix發行說明
minor bug fix開源腳本
秉持TradingView一貫精神,這個腳本的創作者將其設為開源,以便交易者檢視並驗證其功能。向作者致敬!您可以免費使用此腳本,但請注意,重新發佈代碼需遵守我們的社群規範。
免責聲明
這些資訊和出版物並非旨在提供,也不構成TradingView提供或認可的任何形式的財務、投資、交易或其他類型的建議或推薦。請閱讀使用條款以了解更多資訊。
開源腳本
秉持TradingView一貫精神,這個腳本的創作者將其設為開源,以便交易者檢視並驗證其功能。向作者致敬!您可以免費使用此腳本,但請注意,重新發佈代碼需遵守我們的社群規範。
免責聲明
這些資訊和出版物並非旨在提供,也不構成TradingView提供或認可的任何形式的財務、投資、交易或其他類型的建議或推薦。請閱讀使用條款以了解更多資訊。