INVITE-ONLY SCRIPT
D Indicators - Intraday Tool
*Presenting a setup in which there is almost everything that an Intraday Trader needs.
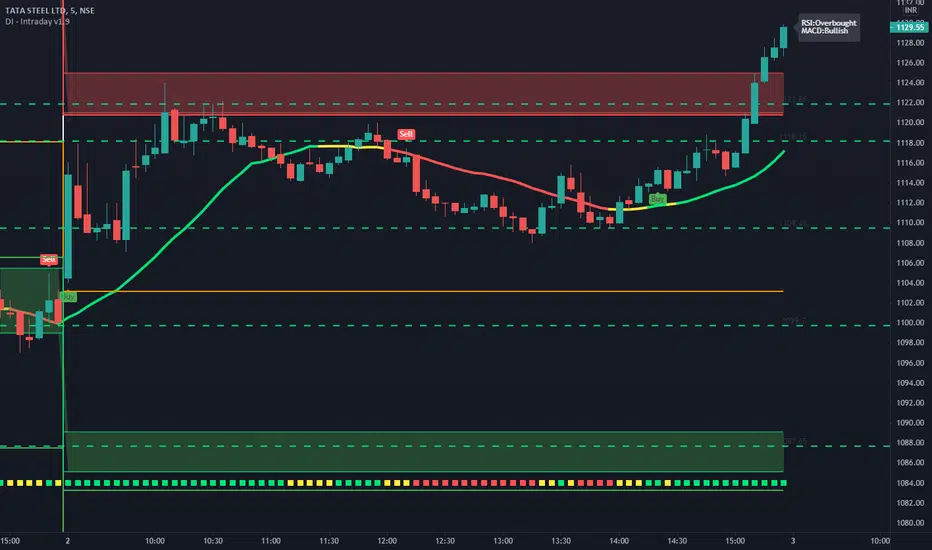
1) Trend Indicators
# Both the trend indicators are multicolored.
# Very simple to Understand. Yellow means no trade zone, green - go long
, and red - go short.
# Trend Indicator 1 is an SMA(20). It will change its color according to the trend
of the market.
# Trend Indicator 2 will be plotted at the bottom of the screen. Based upon RSI
# Buy/Sell labels are synced with Trend Indicator 1. Wait for the close of the candle
to enter.
2) Pivot Points
# Plots Standard Pivots on the chart.
# Additional option for plotting Fibonacci pivots is also given.
# Plots standard pivots up to S5 and R5
# At the middle, it is pivot point (PP) level and multiple
support and resistance levels
3) Daily Range
# It plots 2 important levels at the starting of the day.
# 2 bands are plotted in the morning when the market opens,
resembling strong support/resistance zones.
4) Support/Resistance
# This indicator is used for finding support and resistance levels on charts.
# So one can plan Targets and SL accordingly
# Lines will change color automatically if any candle closes above the support/resistance line. It will change it's
to green. Similarly, it will change its color to red if the price is below the sup
5) CPR and CPR Next Day
# CPR is a very known indicator that indicates whether that helps in-stock selection.
# This is a very crucial indicator as it shows the CPR levels for the next day.
# One can make a guess by looking at the next day's CPR that whether the stock is going to be trendy/sideways the next day.
# Isn't it cool if you had some idea about tomorrow's behavior of the market's trend.
6) VWAP
7) Major Intraday Indicators
# Plots label indicating the status of RSI and MACD.
8) Bollinger Bands
# The Upper and Lower Bands are used as a way to measure volatility
by observing the relationship between the Bands and price
9) First bar of the day
# Plots the high and low of the first candle.
10) Different buy/sell labels and EHMA for forex.
Thanks are regards,
D Indicators
僅限邀請腳本
僅限作者授權的用戶訪問此腳本,並且通常需要付費。您可以將其增加到收藏腳本中,但是只有在向作者請求並獲得許可之後,才能使用它。 請聯繫D_Indicators以了解更多信息,或按照下面作者的說明進行操作。
TradingView 不建議購買並使用此腳本,除非您 100% 信任其作者並了解腳本的工作原理。在許多情況下,您可以在我們的社群腳本中免費找到良好的開源替代方案。
作者的說明
″For access, please contact us.
📞: +91 - 7984128073
WhatsApp: https://wa.me/message/PWOK6HXQWJ6LF1
Telegram:
http://t.me/dindicators1
想在圖表上使用此腳本?
警告:請閱讀,然後再請求訪問權限。
免責聲明
這些資訊和出版物並不意味著也不構成TradingView提供或認可的金融、投資、交易或其他類型的意見或建議。請在使用條款閱讀更多資訊。