OPEN-SOURCE SCRIPT
已更新 CVD Spaghetti - Multi-Exchange (Perpetuals)
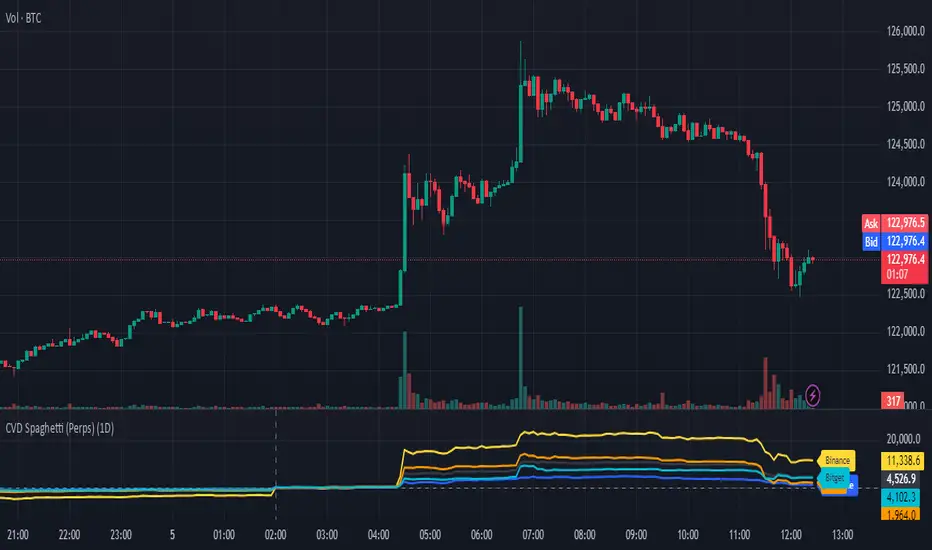
CVD Spaghetti – Multi-Exchange (Perpetuals) is designed to track and visualize Cumulative Volume Delta (CVD) across multiple cryptocurrency perpetual futures exchanges in one consolidated view. This indicator provides traders with a clearer perspective on buying and selling pressure by monitoring how order flow develops on different venues simultaneously.
What it does
The script calculates the CVD for each enabled exchange and plots them as separate lines on a single chart, creating a “spaghetti” style visualization. This allows traders to identify relative strength or weakness between major exchanges, which can often hint at institutional positioning, liquidity shifts, and potential market imbalances.
Why it’s useful
Order flow and liquidity dynamics can differ significantly between exchanges. By aggregating and comparing these flows, traders can:
Detect which venue is leading during trend development.
Spot divergences between exchanges, which may indicate inefficiencies or arbitrage-driven movements.
Gauge overall sentiment strength by comparing multiple sources instead of relying on a single dataset.
Technical details
Anchor Period Reset: The cumulative calculation resets based on the user-defined Anchor Period (default: daily), keeping data relevant for the chosen trading horizon.
Dynamic Resolution: The script automatically selects an appropriate lower timeframe for data requests based on the chart timeframe to maintain responsiveness and accuracy.
Normalization: Not all exchanges report volume in the same way—some use quote currency (USD), others in contracts or ticks. To ensure comparability, this indicator normalizes volumes where necessary:
Bybit USD and OKX contracts are divided by price to approximate base-coin terms.
Single-contract venues (e.g., Deribit) are normalized similarly.
Exchanges already reporting in the base currency remain unchanged.
Multi-Exchange Coverage: Supports major venues including Binance, Bybit, OKX, Bitget, Coinbase, and optional secondary exchanges like Blofin, Whitebit, and Deribit.
Visual Aids:
Zero baseline for directional reference.
Vertical session markers at each reset point.
Optional exchange labels positioned dynamically on the last bar for quick identification.
How traders might use it
Trend confirmation: Strong synchronized CVD across all major exchanges supports continuation; fragmentation may suggest weakening conviction.
Cross-exchange divergence: When one exchange’s CVD diverges from others, it can signal localized liquidity shocks or large player activity.
High-frequency strategies: On lower timeframes, the spaghetti view can highlight which venue is absorbing or providing liquidity fastest, aiding short-term decision-making.
發行說明
Changes in Version 2:- Switched to Tradingview's official CVD calculation method because of data inaccuracy and code context issues.
- Switched the exchanges Blofin, Whitebit & Deribit for Gate.io, HTX & MEXC to improve support for altcoins.
- Added the option to configure all colors, including line and label colors from the input menu in settings directly.
發行說明
Changes in Version 3:- Improved error handling through various measures such as adding ignore_invalid_symbol = true on the exchange pairs where the tick value for normalization is requested.
- Added the CVD calculation method from the library manually and removed unnecessary output parameters from the method as well as the request.security() calls
- Fixed critical flaw where the exchanges total from exchanges with multiple pairs (Binance, Bybit, OKX, Bitget) are added together in the same check, which resulted in the exchanges total being zero even if one pair is valid and provides volume data.
Also here is some additional clarification regarding some of the scripts function that was not mentioned in the original description:
How It Works (Technical Explanation)
Data Source Construction:
The script dynamically builds full TradingView ticker strings (e.g., BINANCE:BTCUSDT.P, BYBIT:BTCUSD.P, etc.) for each enabled exchange, using the chart’s base symbol as reference.
CVD Computation:
By using ta.requestVolumeDelta() on a lower-timeframe feed, the script reconstructs buy/sell volume differentials and aggregates them over the selected anchor period. In essence, it analyzes lower-timeframe data to assess price movement and determine—based on the closing direction of each bar—whether the associated volume is classified as positive or negative. These values are then accumulated to produce the plotted output on the chart.
It’s important to note that this approach provides an approximation, not true directional volume. I chose this method over using tick data, which would more closely represent actual volume delta, because it allows access to historical values for all users, including those without a TradingView subscription. Moreover, this is the official calculation method used by TradingView’s native CVD indicators.
Normalization & Summation:
Contracts where volume is USD-denominated are divided by price to ensure that all symbols are in the same unit (base currency).
Exchanges that have volume denominated in ticks (Gate, HTX, MEXC) are scaled by tick size and normalized to price.
Multi-contract exchanges (like Binance or Bybit) are combined into single representative CVD curves.
Visualization Layer:
The script plots one CVD line per exchange, color-coded for quick distinction, alongside a zero reference line for net-neutral context.
Vertical dashed lines mark where CVD resets according to the chosen anchor period.
How to Use
Apply the Script to any crypto chart, preferably a perpetual-futures chart (e.g., BTCUSDT.P on Binance).
Select Exchanges you want to monitor in the Exchange Selection group.
Adjust Anchor Period (1D, 4H, 8H, etc.) to control how often CVD resets.
Interpretation:
When all exchanges’ CVDs rise together → broad buying pressure across markets.
When only one or two exchanges rise while others stagnate → isolated liquidity imbalance or exchange-specific dominance.
Divergences between price and combined CVD → potential exhaustion or spoofing behavior.
Cross-exchange discrepancies → often precede rebalancing moves as arbitrage restores parity.
Why “Spaghetti”?
When plotted together, the multiple CVD lines from different exchanges form a “spaghetti-like” visual — a layered structure of order-flow dynamics where convergence or divergence between exchanges provides insight into which markets are leading, lagging, or absorbing liquidity.
開源腳本
秉持TradingView一貫精神,這個腳本的創作者將其設為開源,以便交易者檢視並驗證其功能。向作者致敬!您可以免費使用此腳本,但請注意,重新發佈代碼需遵守我們的社群規範。
免責聲明
這些資訊和出版物並非旨在提供,也不構成TradingView提供或認可的任何形式的財務、投資、交易或其他類型的建議或推薦。請閱讀使用條款以了解更多資訊。
免責聲明
這些資訊和出版物並非旨在提供,也不構成TradingView提供或認可的任何形式的財務、投資、交易或其他類型的建議或推薦。請閱讀使用條款以了解更多資訊。