OPEN-SOURCE SCRIPT
Uwen FX: UWEN Strategy
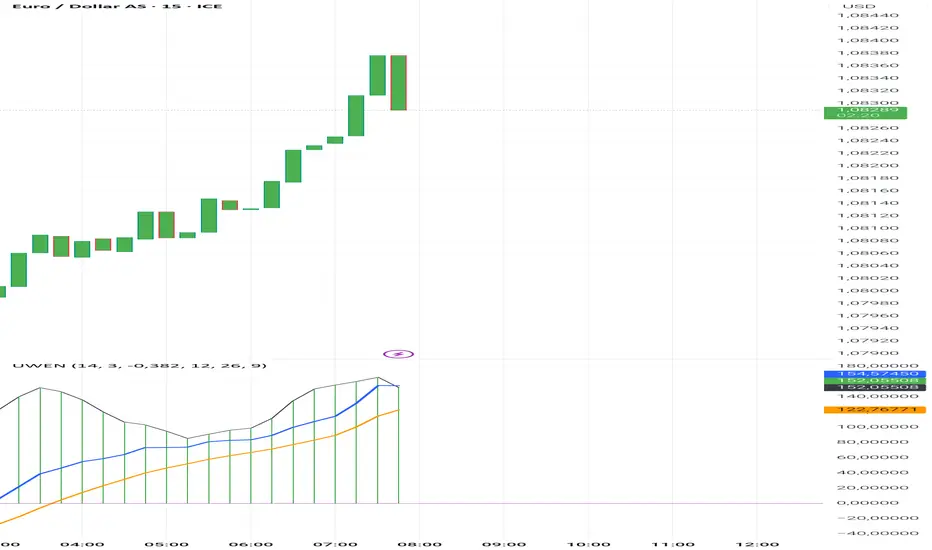
This Pine Script defines a trading indicator called "Uwen FX: UWEN Strategy" Where ideas coming from Arab Syaukani and modified by Fiki Hafana. It combines a CCI-based T3 Smoothed Indicator with a MACD overlay. Here's a breakdown of what it does:
Key Components of the Script:
1. CCI (Commodity Channel Index) with T3 Smoothing
Uses a T3 smoothing algorithm on the CCI to generate a smoother momentum signal. The smoothing formula is applied iteratively using weighted averages. The final result (xccir) is plotted as a histogram, colored green for bullish signals and red for bearish signals.
2. MACD (Moving Average Convergence Divergence)
The MACD is scaled to match the range of the smoothed CCI for better visualization. Signal Line and MACD Line are plotted if showMACD is enabled. The normalization ensures that MACD values align with the CCI-based indicator.
3. Bar Coloring for Trend Indication
Green bars indicate a positive trend (pos = 1).
Red bars indicate a negative trend (pos = -1).
Blue bars appear when the trend is neutral.
How It Can Be Used:
Buy Signal: When the xccir (smoothed CCI) turns green, indicating bullish momentum.
Sell Signal: When xccir turns red, indicating bearish momentum.
MACD Confirmation: Helps confirm the trend direction by aligning with xccir.
I will add more interesting features if this indicator seems profitable
開源腳本
秉持TradingView一貫精神,這個腳本的創作者將其設為開源,以便交易者檢視並驗證其功能。向作者致敬!您可以免費使用此腳本,但請注意,重新發佈代碼需遵守我們的社群規範。
免責聲明
這些資訊和出版物並非旨在提供,也不構成TradingView提供或認可的任何形式的財務、投資、交易或其他類型的建議或推薦。請閱讀使用條款以了解更多資訊。
開源腳本
秉持TradingView一貫精神,這個腳本的創作者將其設為開源,以便交易者檢視並驗證其功能。向作者致敬!您可以免費使用此腳本,但請注意,重新發佈代碼需遵守我們的社群規範。
免責聲明
這些資訊和出版物並非旨在提供,也不構成TradingView提供或認可的任何形式的財務、投資、交易或其他類型的建議或推薦。請閱讀使用條款以了解更多資訊。