OPEN-SOURCE SCRIPT
Stock Sector ETF with Indicators

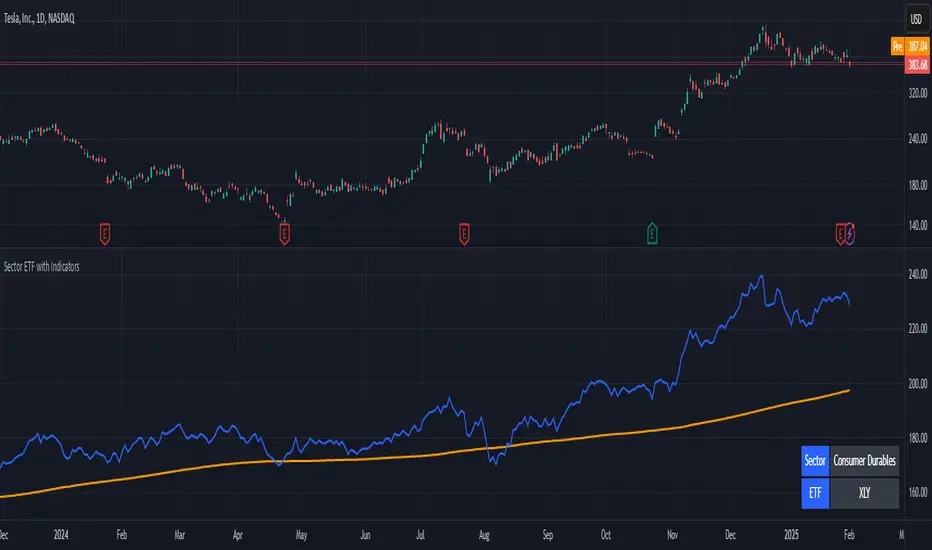
The Stock Sector ETF with Indicators is a versatile tool designed to track the performance of sector-specific ETFs relative to the current asset. It automatically identifies the sector of the underlying symbol and displays the corresponding ETF’s price action alongside key technical indicators. This helps traders analyze sector trends and correlations in real time.
---
Key Features
Automatic Sector Detection:
Technical Indicators:
Customizable Inputs:
Informative Table:
---
Input Settings
SMA Settings
Bollinger Bands Settings
Donchian High (52-Week High)
Sector Selections
---
Example Use Cases
---
Key Features
Automatic Sector Detection:
- Fetches the sector of the current asset (e.g., "Technology" for AAPL).
- Maps the sector to a user-defined ETF (default: SPDR sector ETFs)[using close prices].
Technical Indicators:
- Simple Moving Average (SMA): Tracks the ETF’s trend.
- Bollinger Bands: Highlights volatility and potential reversals.
- Donchian High (52-Week High): Identifies long-term resistance levels.
Customizable Inputs:
- Adjust indicator parameters (length, visibility).
- Override default ETFs for specific sectors.
Informative Table:
- Displays the current sector and ETF symbol in the bottom-right corner.
---
Input Settings
SMA Settings
- SMA Length: Period for calculating the Simple Moving Average (default: 200).
- Show SMA: Toggle visibility of the SMA line.
Bollinger Bands Settings
- BB Length: Period for Bollinger Bands calculation (default: 20).
- BB Multiplier: Standard deviation multiplier (default: 2.0).
- Show Bollinger Bands: Toggle visibility of the bands.
Donchian High (52-Week High)
- Daily High Length: Days used to calculate the high (default: 252, approx. 1 year).
- Show High: Toggle visibility of the 52-week high line.
Sector Selections
- Customize ETFs for each sector (e.g., replace XLU with another utilities ETF).
---
Example Use Cases
- Trend Analysis: Compare a stock’s price action to its sector ETF’s SMA for trend confirmation.
- Volatility Signals: Use Bollinger Bands to spot ETF price squeezes or breakouts.
- Sector Strength: Monitor if the ETF is approaching its 52-week high to gauge sector momentum.
Enjoy tracking sector trends with ease! 🚀
開源腳本
秉持TradingView一貫精神,這個腳本的創作者將其設為開源,以便交易者檢視並驗證其功能。向作者致敬!您可以免費使用此腳本,但請注意,重新發佈代碼需遵守我們的社群規範。
免責聲明
這些資訊和出版物並非旨在提供,也不構成TradingView提供或認可的任何形式的財務、投資、交易或其他類型的建議或推薦。請閱讀使用條款以了解更多資訊。
開源腳本
秉持TradingView一貫精神,這個腳本的創作者將其設為開源,以便交易者檢視並驗證其功能。向作者致敬!您可以免費使用此腳本,但請注意,重新發佈代碼需遵守我們的社群規範。
免責聲明
這些資訊和出版物並非旨在提供,也不構成TradingView提供或認可的任何形式的財務、投資、交易或其他類型的建議或推薦。請閱讀使用條款以了解更多資訊。