OPEN-SOURCE SCRIPT
已更新 Weekly and daily separators
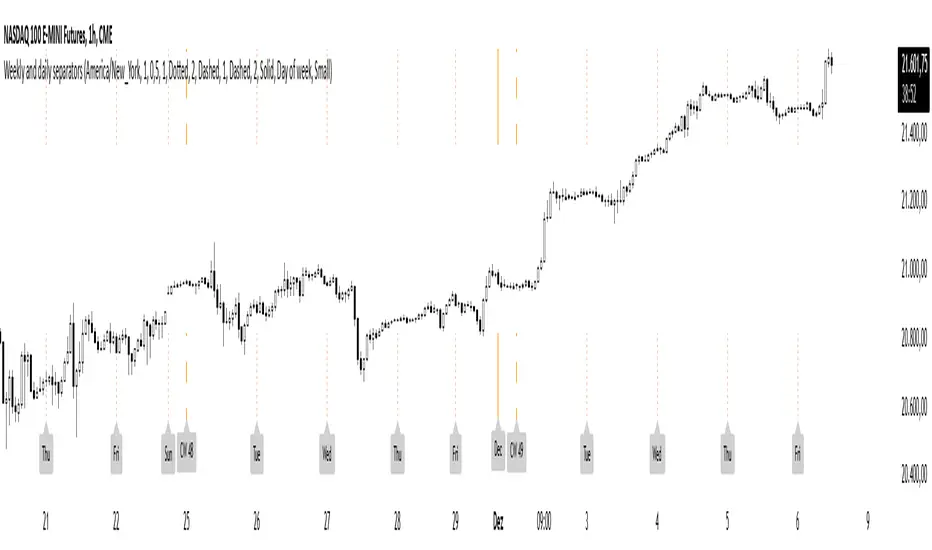
This script plots vertical line between each trading week (thick, solid) and smaller lines (dotted) between each trading day. This helps kepping a better overview on the aspect of time on the higher timeframes below 1D. The distance of the lines to the top and bottom of the chart is controlled by your chart settings menu under Appearance -> Margins.
發行說明
Increased the number of lines displayed發行說明
Added support to hide the daily lines on the daily chart and higher and the same for the weekly lines on the weekly chart and higher. On the timeframes from the daily and above the weekly has a secondary line width too. This should help make the charts look cleanerThis is configurable in the parameters now and the line widths can be selected.
發行說明
Minor cosmetic changes and added 2 parameters for better control發行說明
Choose Line style and width independently now發行說明
Fixed color selection and changed default values發行說明
Higher tf color option發行說明
Added monthly line發行說明
Default config changed發行說明
This update includes a bunch of changes that should make the indicator easier to use and more customizable. Even more importantly I fundamentally changed the way a change of day/week/month is detected. This should now be more stable and print more consistently for each timeframe.Further added features:
- Select time zone for when the session change should be marked
- Lines don't have to paint all the way across the chart vertically but can be adjusted to just have some part of the top and bottom covered.
- Optional labels can be toggled which show the starting month, calendar week and day. Available day formats are either the weekday or the date either in the format dd.MM or MM.dd
- Default line widths and colors changed to a orange hue
發行說明
Updated chart to match last major update開源腳本
秉持TradingView一貫精神,這個腳本的創作者將其設為開源,以便交易者檢視並驗證其功能。向作者致敬!您可以免費使用此腳本,但請注意,重新發佈代碼需遵守我們的社群規範。
免責聲明
這些資訊和出版物並非旨在提供,也不構成TradingView提供或認可的任何形式的財務、投資、交易或其他類型的建議或推薦。請閱讀使用條款以了解更多資訊。
開源腳本
秉持TradingView一貫精神,這個腳本的創作者將其設為開源,以便交易者檢視並驗證其功能。向作者致敬!您可以免費使用此腳本,但請注意,重新發佈代碼需遵守我們的社群規範。
免責聲明
這些資訊和出版物並非旨在提供,也不構成TradingView提供或認可的任何形式的財務、投資、交易或其他類型的建議或推薦。請閱讀使用條款以了解更多資訊。