OPEN-SOURCE SCRIPT
Wick Strength [MS]
Overview
The Wick Strength indicator is a unique script designed to measure and visualize the relative strength of candlestick wicks over time. By analyzing the relationship between upper and lower wicks, this indicator provides insights into potential market dynamics and price action patterns.
How It Works
The Wick Strength indicator calculates the "strength" of candlestick wicks by comparing the upward and downward movements within each candle's range. This calculation results in a dynamic line plot that represents the evolving wick strength across your chosen timeframe.
Strength is not range-bound, allowing the score to reach extremes and be compared relatively across time.
Interpretation
Key Features
Measures relative wick strength candle by candle
Smooths the values by summation based on user preference
Adaptable to all timeframes and markets
Potential Applications
While extensive backtesting has not been performed, the Wick Strength indicator may offer valuable insights for:
The Wick Strength indicator is a unique script designed to measure and visualize the relative strength of candlestick wicks over time. By analyzing the relationship between upper and lower wicks, this indicator provides insights into potential market dynamics and price action patterns.
How It Works
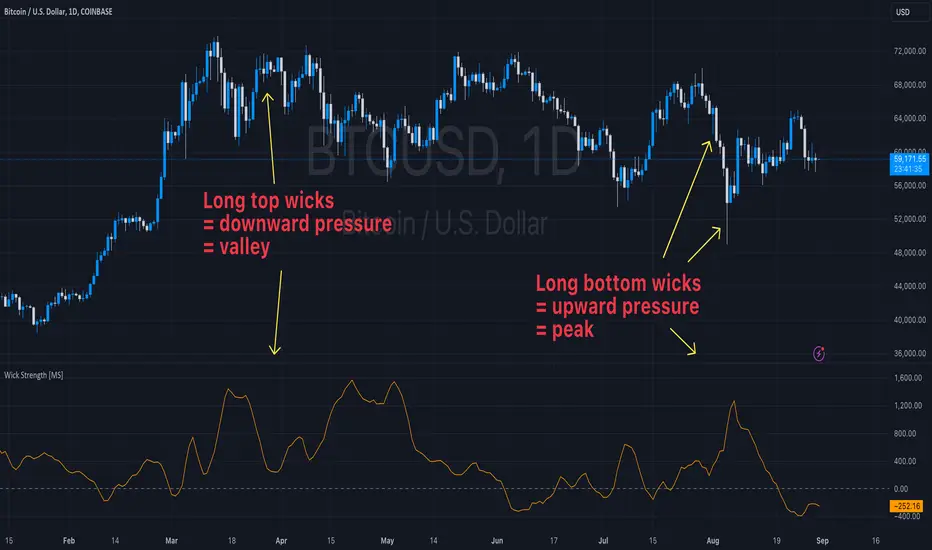
The Wick Strength indicator calculates the "strength" of candlestick wicks by comparing the upward and downward movements within each candle's range. This calculation results in a dynamic line plot that represents the evolving wick strength across your chosen timeframe.
Strength is not range-bound, allowing the score to reach extremes and be compared relatively across time.
Interpretation
- Positive values indicate stronger upper wicks (potential bearish pressure)
- Negative values suggest stronger lower wicks (potential bullish pressure)
- Extreme readings might signal overextended moves or potential reversals
Key Features
Measures relative wick strength candle by candle
Smooths the values by summation based on user preference
Adaptable to all timeframes and markets
Potential Applications
While extensive backtesting has not been performed, the Wick Strength indicator may offer valuable insights for:
- Identifying potential divergences between price action and wick strength
- Spotting changes in market sentiment or volatility
- Complementing other technical analysis tools for a more comprehensive trading approach
- Developing unique trading strategies based on wick behavior
開源腳本
秉持TradingView一貫精神,這個腳本的創作者將其設為開源,以便交易者檢視並驗證其功能。向作者致敬!您可以免費使用此腳本,但請注意,重新發佈代碼需遵守我們的社群規範。
For script access or PineScript questions, please visit our site:
marketscripters.com?utm_source=tradingview&utm_medium=signature
marketscripters.com?utm_source=tradingview&utm_medium=signature
免責聲明
這些資訊和出版物並非旨在提供,也不構成TradingView提供或認可的任何形式的財務、投資、交易或其他類型的建議或推薦。請閱讀使用條款以了解更多資訊。