OPEN-SOURCE SCRIPT
已更新 Time-it
Time-it = Time based indicator
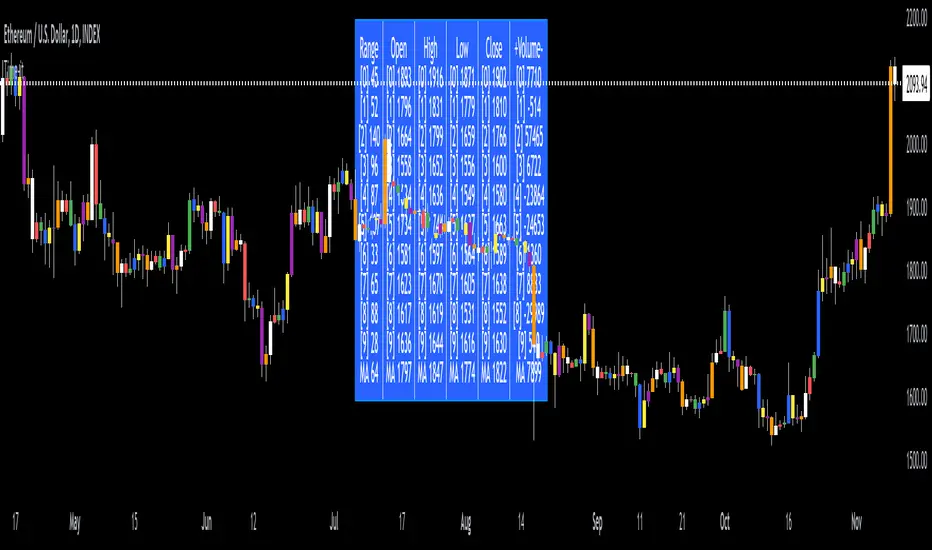
The Time-it indicator parses data by the day of week. Every tradeable instrument has its own personality. Some are more volatile on Mondays, and some are more bullish / bearish on Fridays or any day in between. The key metrics Time-it parses is range, open, high, low, close and +volume-.
The Time-it parsed data is printed in a table format. The table, position, size & color and text color & size can be changed to your preference. Each column parsed data is the last 10 which is numbered 0-9 which refers to the number of the selected day bars ago. For example: if Monday is chosen, 0 is the last closed Monday bar and 9 is the last closed Monday 9 Monday bars ago.
Range = measures the range between high and low for the day.
Open = is the opening price for the day.
High = is the high price for the day.
Low = is the low price for the day.
Close = is the closing price for the day.
+volume- = is the positive or negative volume for the day.
Default settings:
*Represents a how to use tooltip*
Source = ohlc4
* The source used for MA
MA length = 20
* The moving average used
Day bar color on / off
* checked on / unchecked off
Monday = blue
Tuesday = yellow
Wednesday = purple
Thursday = orange
Friday = white
Saturday = red
Sunday = green
Day M, T, W, TH, F, ST, SN.
* Parsed data for the day of week tables
Table, position, size & color:
Top, middle, bottom, left, center, right
* Table position on the chart.
Frame width & border width = 1
Text color and text size
Border color and frame color
Decimal place = 0
* example: use 0 for a round number, use 4 for Forex

*** The Time-it indicator uses parts and/or pieces of code from "Tradingview Up/Down Volume" and "Tradingview Financials on Chart".
The Time-it indicator parses data by the day of week. Every tradeable instrument has its own personality. Some are more volatile on Mondays, and some are more bullish / bearish on Fridays or any day in between. The key metrics Time-it parses is range, open, high, low, close and +volume-.
The Time-it parsed data is printed in a table format. The table, position, size & color and text color & size can be changed to your preference. Each column parsed data is the last 10 which is numbered 0-9 which refers to the number of the selected day bars ago. For example: if Monday is chosen, 0 is the last closed Monday bar and 9 is the last closed Monday 9 Monday bars ago.
Range = measures the range between high and low for the day.
Open = is the opening price for the day.
High = is the high price for the day.
Low = is the low price for the day.
Close = is the closing price for the day.
+volume- = is the positive or negative volume for the day.
Default settings:
*Represents a how to use tooltip*
Source = ohlc4
* The source used for MA
MA length = 20
* The moving average used
Day bar color on / off
* checked on / unchecked off
Monday = blue
Tuesday = yellow
Wednesday = purple
Thursday = orange
Friday = white
Saturday = red
Sunday = green
Day M, T, W, TH, F, ST, SN.
* Parsed data for the day of week tables
Table, position, size & color:
Top, middle, bottom, left, center, right
* Table position on the chart.
Frame width & border width = 1
Text color and text size
Border color and frame color
Decimal place = 0
* example: use 0 for a round number, use 4 for Forex
*** The Time-it indicator uses parts and/or pieces of code from "Tradingview Up/Down Volume" and "Tradingview Financials on Chart".
發行說明
Sync day of week bar color with table color.開源腳本
秉持TradingView一貫精神,這個腳本的創作者將其設為開源,以便交易者檢視並驗證其功能。向作者致敬!您可以免費使用此腳本,但請注意,重新發佈代碼需遵守我們的社群規範。
Trading indicators:
tradingview.com/u/Options360/
tradingview.com/u/Options360/
免責聲明
這些資訊和出版物並非旨在提供,也不構成TradingView提供或認可的任何形式的財務、投資、交易或其他類型的建議或推薦。請閱讀使用條款以了解更多資訊。
開源腳本
秉持TradingView一貫精神,這個腳本的創作者將其設為開源,以便交易者檢視並驗證其功能。向作者致敬!您可以免費使用此腳本,但請注意,重新發佈代碼需遵守我們的社群規範。
Trading indicators:
tradingview.com/u/Options360/
tradingview.com/u/Options360/
免責聲明
這些資訊和出版物並非旨在提供,也不構成TradingView提供或認可的任何形式的財務、投資、交易或其他類型的建議或推薦。請閱讀使用條款以了解更多資訊。