OPEN-SOURCE SCRIPT
已更新 Moving Average Gap Analyzer
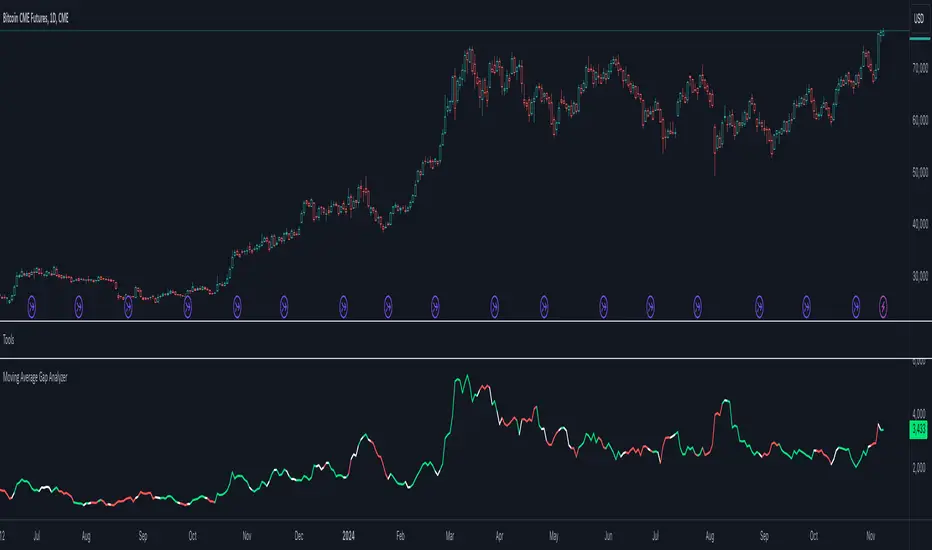
Extremely simple algorithm in order to calculate the gap between 2 simple moving averages. Analyzing perspective defines the line of color as white, green or red. This is done by checking sources of both moving averages and evaluate their past values with the mutual length respectively. Analysis is done by scoring the movements of sources.
What to expect?
- Higher the gap, higher the volatility.
- If the analysis line is green sources have been raising (most likely bull market), if the analysis line is white the market is mostly likely close to horizontal, if the analysis line is red, sources have been decreasing gradually (most likely bear market).
ps. Genuine indicator idea of me. This indicator is not a product or an idea of any group I work with. Completely clear of all types of IP.
發行說明
- Option for selecting MA type added.發行說明
- Script updated from Pine Script v4 to Pine Script v5
- Dynamic moving average function moved to a library (Tools)
- Strict variable types implemented & applied
開源腳本
秉持TradingView一貫精神,這個腳本的創作者將其設為開源,以便交易者檢視並驗證其功能。向作者致敬!您可以免費使用此腳本,但請注意,重新發佈代碼需遵守我們的社群規範。
免責聲明
這些資訊和出版物並非旨在提供,也不構成TradingView提供或認可的任何形式的財務、投資、交易或其他類型的建議或推薦。請閱讀使用條款以了解更多資訊。
免責聲明
這些資訊和出版物並非旨在提供,也不構成TradingView提供或認可的任何形式的財務、投資、交易或其他類型的建議或推薦。請閱讀使用條款以了解更多資訊。