OPEN-SOURCE SCRIPT
Candle + Volume as Histogram
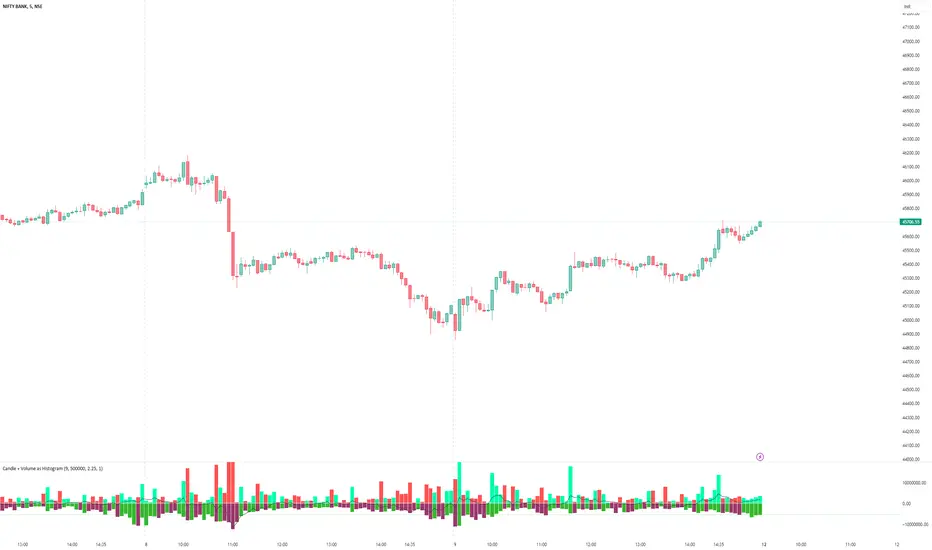
Now plot Candle and Volume as Histogram Oscillator. It is a very simple but very effective indicator to see what is happening at Volume and Candle levels. It clearly plots whether the market is trending, volatile, what is going to happen in next candles etc. Above Zero is price candle and below Zero is Volume histogram.
SETTINGS:
EMA : 9 period EMA on price is default, which I find the best, but you can change as you likes. Below zero line shows market is in negative phase and above zero market is positive.
PRICE CANDLE : As price and volume have different numeric value, so you have to use multiplier to set the proper price candle, which is plotted above zero
VOLUME : As price and volume have different numeric value, so you have to use multiplier to set the Volume candle, which is plotted below zero.
ZERO LINE : use ‘Gap between Candle and Volume plotting’. Increase the value until you see a thin line between price and volume histogram.
NOTE: (i) When you will plot the indicator for the first time, either price candle may not be appearing properly or volume. It means that non-appearing histogram side needs multiplication, so keep on increasing value on proper side until both side histogram appears properly.
(ii) In other case. Price or volume histogram may appear as full Candle. In this case too, you need to increase multiplier value on opposite side till value becomes equal on both sides.
These settings are important because a share price can be 10 only whereas volume may be in millions. Indicator has been tested on many shares and indexes, so never feels that indicator is improper. Just try to change the setting.
Enjoy.
開源腳本
秉持TradingView一貫精神,這個腳本的創作者將其設為開源,以便交易者檢視並驗證其功能。向作者致敬!您可以免費使用此腳本,但請注意,重新發佈代碼需遵守我們的社群規範。
免責聲明
這些資訊和出版物並非旨在提供,也不構成TradingView提供或認可的任何形式的財務、投資、交易或其他類型的建議或推薦。請閱讀使用條款以了解更多資訊。
開源腳本
秉持TradingView一貫精神,這個腳本的創作者將其設為開源,以便交易者檢視並驗證其功能。向作者致敬!您可以免費使用此腳本,但請注意,重新發佈代碼需遵守我們的社群規範。
免責聲明
這些資訊和出版物並非旨在提供,也不構成TradingView提供或認可的任何形式的財務、投資、交易或其他類型的建議或推薦。請閱讀使用條款以了解更多資訊。