OPEN-SOURCE SCRIPT
已更新 Trend Strength Indicator
This indicator uses Heiken Ashi candle data to plot trend strength signals to your chart.
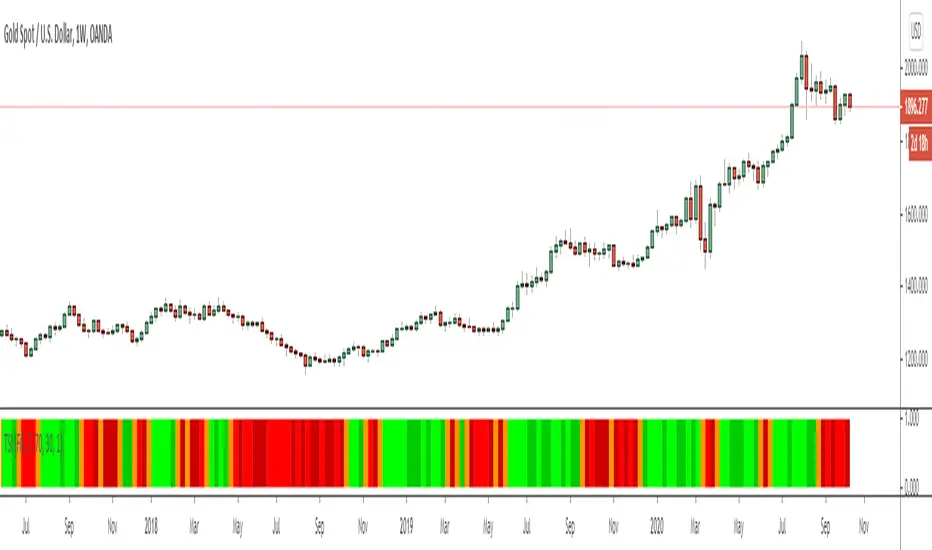
Bright Green: Heiken Ashi candle data is still putting in higher lows and higher highs, and the price closed above the previous low.
Dark Green: Heiken Ashi candle closed green, but had a lower low or lower high (trend weakening).
Bright Red: Heiken Ashi candle data is still putting in lower lows and lower highs, and the price closed below the previous high.
Dark Red: Heiken Ashi candle closed red, but had a higher low or higher high (trend weakening).
Optional: I included a setting for allowing high RSI values to overrule Heiken Ashi values (disabled by default).
This kind of indicator is best used for managing open positions rather than entering trades. It works on all timeframes and instruments.
Feel free to contact me if you have any questions :)
Regards,
- Matt
PS. Here's a snapshot of it against a Heiken Ashi chart for reference:
發行說明
Added -1 offset value to trend strength bars so that they align properly with candles.發行說明
- Turned RSI override on by default to improve trend strength signal accuracy.發行說明
Added ability to reference higher timeframe發行說明
Removed HTF functionality as repainting issues were creating problems.Indicator no longer repaints, and only uses the current timeframe data for signals.
發行說明
-- Converted to Pine Script version 4
- Several minor code improvements & optimizations
- Added candle offset (0 = use current bar data, 1 = use previous bar data)
發行說明
Updated to Pine Script v5發行說明
Updated to pine script v6開源腳本
秉持TradingView一貫精神,這個腳本的創作者將其設為開源,以便交易者檢視並驗證其功能。向作者致敬!您可以免費使用此腳本,但請注意,重新發佈代碼需遵守我們的社群規範。
My Resources Hub: theartoftrading.com
FREE YouTube Lessons: rebrand.ly/zyt
FREE Pine Script Basics Course: rebrand.ly/zpsbc
Pine Script MASTERY Course: rebrand.ly/zpsmc
My Indicators & Strategies: rebrand.ly/zmisc
FREE YouTube Lessons: rebrand.ly/zyt
FREE Pine Script Basics Course: rebrand.ly/zpsbc
Pine Script MASTERY Course: rebrand.ly/zpsmc
My Indicators & Strategies: rebrand.ly/zmisc
免責聲明
這些資訊和出版物並非旨在提供,也不構成TradingView提供或認可的任何形式的財務、投資、交易或其他類型的建議或推薦。請閱讀使用條款以了解更多資訊。
開源腳本
秉持TradingView一貫精神,這個腳本的創作者將其設為開源,以便交易者檢視並驗證其功能。向作者致敬!您可以免費使用此腳本,但請注意,重新發佈代碼需遵守我們的社群規範。
My Resources Hub: theartoftrading.com
FREE YouTube Lessons: rebrand.ly/zyt
FREE Pine Script Basics Course: rebrand.ly/zpsbc
Pine Script MASTERY Course: rebrand.ly/zpsmc
My Indicators & Strategies: rebrand.ly/zmisc
FREE YouTube Lessons: rebrand.ly/zyt
FREE Pine Script Basics Course: rebrand.ly/zpsbc
Pine Script MASTERY Course: rebrand.ly/zpsmc
My Indicators & Strategies: rebrand.ly/zmisc
免責聲明
這些資訊和出版物並非旨在提供,也不構成TradingView提供或認可的任何形式的財務、投資、交易或其他類型的建議或推薦。請閱讀使用條款以了解更多資訊。