OPEN-SOURCE SCRIPT
已更新 Gradient Value Overlay
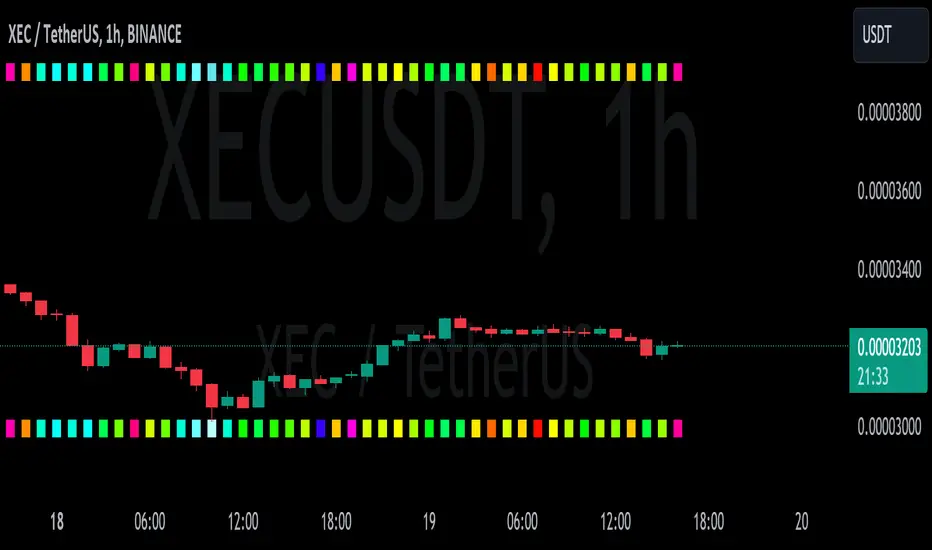
This script helps with identifying certain conditions without cluttering too much of the candles.
Some use cases:
It helps identify rsi low and high values.
Directional price movement becoming difficult.
low and high volume.
it uses a percent rank to distinguish low and high values.
It then uses a gradient to match the percentile rank to heatmap type colors.
i.e. dark blue for lowest volume, white for highest volume.
Current options are:
max bars to use.
approximate color - This value will attempt to give an approximation of what the color might be for the candle close.
e.g. If you're on the 1-hour chart, and only 30 minutes have past, it will multiple the current volume by 1.5. As time passes, if no volume comes in eventually, it will multiply current volume by 1.
This approximate value is only set to work with volume-based options.
option - select the type of value you'd like to see the gradient for.
timeframe - get values from a different chart timeframe.
on/off - turns the gradient on or off.
Gradient type - color wheel or heatmap. Currently these are the only two gardient options.
color wheel's colors for low to high values:
color wheel's current colors:
dark blue
purple
pink
red
orange
yellow
green
teal
white
heatmap's current colors from low values to high values:
dark blue
purple
pink
red
orange
yellow
white
reverse gradient - will reverse the colors so dark blue will be the high value and white will be the low value. Some charts based on previous data; you might need to switch the gradient colors.
moving average length while inside timeframe - an exponential moving average is applied to the values. At 1, there is no moving average applied.
Use case for this is to smooth out the gradient.
An example use case - if your currently on the 1-hour chart, you can set the timeframe to 1 minute and then the moving average length inside timeframe to 60. You will then be seeing the color sixty 1-minute bars.
current timeframe moving average length - an exponential moving average applied to current gradient (helps with smoothing gradient).
Smooth, further smooths values.
There is no set rule for what moving average lengths to use. Adjust timeframe, and moving average lengths to get an insight.
發行說明
added gaps, moneyflow, price range.發行說明
corrected "time between candles" to work correctly.發行說明
I didn't do much testing so hopefully it work.I've made the color wheel gradient colors available for adjustments.
The only way to turn off an individual color is to set it to transparent. If you increase the moving average or smoothing, it will blend the transparent color with neighbouring colors.
The numbers next to the colors are the percent ranks. So the first color dark blue will fall between zero and 3.125.
*note: The time intervals between candle closes no longer work well. Previously, slow moving charts or candles might take 90 seconds until there a chart tick for the candle to be considered to be closed. It now rounds it up to the nearest minute instead of the actual seconds it took for the tick to happen. If you have a premium account, it might still work well if you set it to the seconds timeframe.
開源腳本
秉持TradingView一貫精神,這個腳本的創作者將其設為開源,以便交易者檢視並驗證其功能。向作者致敬!您可以免費使用此腳本,但請注意,重新發佈代碼需遵守我們的社群規範。
免責聲明
這些資訊和出版物並非旨在提供,也不構成TradingView提供或認可的任何形式的財務、投資、交易或其他類型的建議或推薦。請閱讀使用條款以了解更多資訊。
開源腳本
秉持TradingView一貫精神,這個腳本的創作者將其設為開源,以便交易者檢視並驗證其功能。向作者致敬!您可以免費使用此腳本,但請注意,重新發佈代碼需遵守我們的社群規範。
免責聲明
這些資訊和出版物並非旨在提供,也不構成TradingView提供或認可的任何形式的財務、投資、交易或其他類型的建議或推薦。請閱讀使用條款以了解更多資訊。