OPEN-SOURCE SCRIPT
India VIX
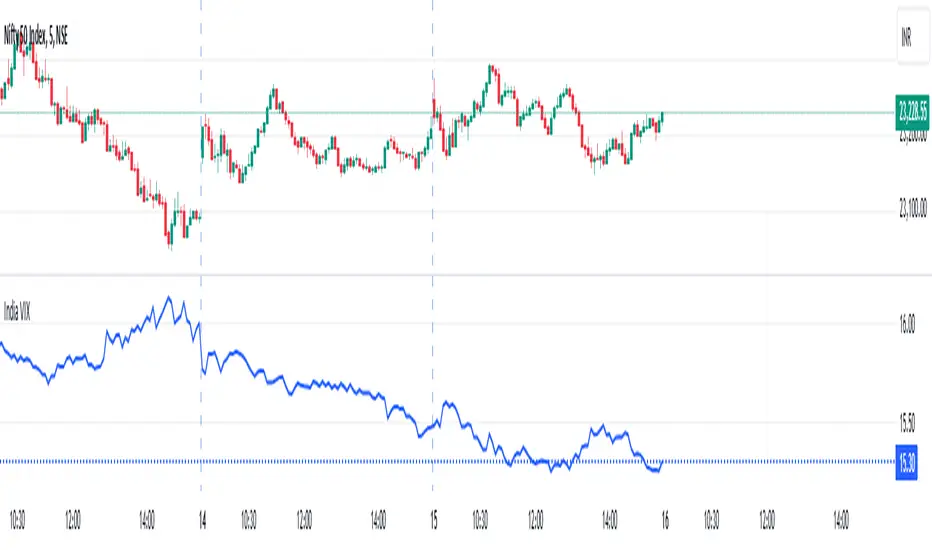
The VIX chart represents the Volatility Index, commonly referred to as the "Fear Gauge" of the stock market. It measures the market's expectations of future volatility over the next 30 days, based on the implied volatility of NSE index options. The VIX is often used as an indicator of investor sentiment, reflecting the level of fear or uncertainty in the market.
Here’s a breakdown of what you might observe on a typical VIX chart:
VIX Value: The y-axis typically represents the VIX index value, with higher values indicating higher levels of expected market volatility (more fear or uncertainty), and lower values signaling calm or stable market conditions.
VIX Spikes: Large spikes in the VIX often correspond to market downturns or periods of heightened uncertainty, such as during financial crises or major geopolitical events. A high VIX is often associated with a drop in the stock market.
VIX Drops: A decline in the VIX indicates a reduction in expected market volatility, usually linked with periods of market calm or rising stock prices.
Trend Analysis: Technical traders might use moving averages or other indicators on the VIX chart to assess the potential for future market movements.
Inverse Relationship with the Stock Market: Typically, there is an inverse correlation between the VIX and the stock market. When stocks fall sharply, volatility increases, and the VIX tends to rise. Conversely, when the stock market rallies or remains stable, the VIX tends to fall.
A typical interpretation would be that when the VIX is low, the market is relatively stable, and when the VIX is high, the market is perceived to be uncertain or volatile.
開源腳本
秉持TradingView一貫精神,這個腳本的創作者將其設為開源,以便交易者檢視並驗證其功能。向作者致敬!您可以免費使用此腳本,但請注意,重新發佈代碼需遵守我們的社群規範。
免責聲明
這些資訊和出版物並非旨在提供,也不構成TradingView提供或認可的任何形式的財務、投資、交易或其他類型的建議或推薦。請閱讀使用條款以了解更多資訊。
開源腳本
秉持TradingView一貫精神,這個腳本的創作者將其設為開源,以便交易者檢視並驗證其功能。向作者致敬!您可以免費使用此腳本,但請注意,重新發佈代碼需遵守我們的社群規範。
免責聲明
這些資訊和出版物並非旨在提供,也不構成TradingView提供或認可的任何形式的財務、投資、交易或其他類型的建議或推薦。請閱讀使用條款以了解更多資訊。