OPEN-SOURCE SCRIPT
已更新 Deviation Channels
Indicator Name: Deviation Channels (Dev Chan)
Why Use This Indicator?
Visualize Volatility Ranges:
The indicator plots Keltner Channels at four levels above and below an average line, letting you easily see how far price has deviated from a typical range. Each “dev” line highlights potential support or resistance during pullbacks or surges.
Color-Coded Clarity:
Each band shifts color intensity depending on whether the current price is trading above or below it, letting you spot breakouts and rejections at a glance. Meanwhile, the Fast SMA (default 10) also changes color – green if price is above, red if below – adding a quick momentum read.
Adjustable Source & Length:
Choose your input source (open, close, ohlc4, or hlc3) and set your Keltner length to suit different asset classes or timeframes. Whether you want a tighter, more reactive channel or a smoother, longer-term reading, the script adapts with minimal effort.
A Simple Trading Approach
Identify Trend with Fast SMA:
If the Fast SMA (default length 10) is green (price above it), treat that as a bullish environment. If it’s red (price below), favor bearish or neutral stances.
Wait for Price to Reach Lower/Upper Deviations:
In a bullish setup (Fast SMA green), watch for price to dip into one of the lower channels (e.g., -1 Dev or -2 Dev). Such pullbacks can become potential “buy the dip” zones if price stabilizes and resumes upward momentum.
Conversely, if the Fast SMA is red, watch for price to test the upper channels (1 Dev or 2 Dev). That might be a short opportunity or a place to close out any remaining longs before a deeper correction.
Manage Risk with Channel Levels:
Place stop-losses just beyond the next “dev” band to protect against volatility. For example, if you enter on a bounce at -1 Dev, consider placing a stop near -2 Dev or -3 Dev, depending on your risk tolerance.
Take Profits Gradually:
In an uptrend, you might scale out of positions as price moves toward higher lines (e.g., 1 Dev or 2 Dev). Conversely, if price fails to hold above the Fast SMA or repeatedly closes below a key band, it might be time to exit.
Disclaimer: No single indicator is foolproof. Always combine with sound risk management, observe multiple timeframes, and consider fundamental factors before making trading decisions. Experiment with the Keltner length and Fast SMA fastLength to find the sweet spot for your market and time horizon.
發行說明
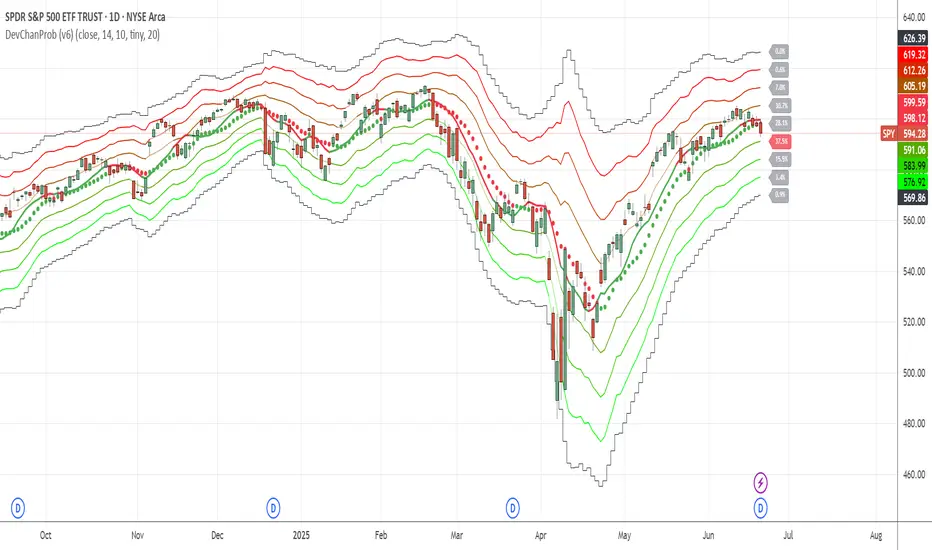
Indicator Name: Deviation Channels with Probability (DevChanProb)Why Use This Indicator?
Visualize Volatility Ranges: The indicator plots Keltner Channels at four standard deviation levels above and below an average price, letting you easily see how far the price has moved from its typical range. Each “dev” line highlights potential support or resistance zones.
Gain a Statistical Edge with Probability Labels: This is more than just a channel indicator. It calculates and displays the historical probability of the price hitting each deviation level based on whether the previous candle was bullish or bearish. This gives you data-driven insights into potential price targets.
Instantly Spot High-Probability Zones: The script automatically highlights the channel with the highest statistical probability of being tested on the next bar, drawing your attention to the most likely turning points or continuation targets.
Color-Coded for Clarity: Each band shifts color intensity depending on whether the current price is trading above or below it. The Fast SMA also changes color—green if the price is above, red if below—for a quick momentum read.
Fully Customizable: Choose your input source (close, ohlc4, etc.), and set the Keltner and SMA lengths to suit different assets or timeframes. You can also customize the appearance of the probability labels to keep your chart clean.
A Simple Trading Approach
Identify the Trend with the Fast SMA:
If the Fast SMA (default length 10) is green (price above it), the environment is bullish.
If it’s red (price below), favor bearish or neutral stances.
Look for High-Probability Entries:
In a bullish setup (green SMA), watch for price to pull back toward a lower channel (e.g., -1 or -2 Dev). If that channel also shows a high probability percentage, it signals a statistically stronger “buy the dip” opportunity.
In a bearish setup (red SMA), a test of an upper channel with a high probability could signal a strong short entry or a place to exit longs.
Use Probabilities to Manage Trades:
Risk Management: Place stop-losses just beyond a key deviation band. For instance, if you enter on a bounce at the -1 Dev line, a stop below the -2 Dev line can provide a logical buffer against volatility.
Profit Taking: In an uptrend, consider scaling out of positions as the price approaches an upper deviation level, especially one with a high probability of being hit. If the price consistently fails to hold a key level, it may be time to exit.
Disclaimer: No single indicator is foolproof. The probabilities are based on historical data and do not guarantee future results. Always combine this tool with sound risk management, observe multiple timeframes, and consider market context before making trading decisions. Experiment with the settings to find what works best for your market and strategy.
開源腳本
秉持TradingView一貫精神,這個腳本的創作者將其設為開源,以便交易者檢視並驗證其功能。向作者致敬!您可以免費使用此腳本,但請注意,重新發佈代碼需遵守我們的社群規範。
免責聲明
這些資訊和出版物並非旨在提供,也不構成TradingView提供或認可的任何形式的財務、投資、交易或其他類型的建議或推薦。請閱讀使用條款以了解更多資訊。
免責聲明
這些資訊和出版物並非旨在提供,也不構成TradingView提供或認可的任何形式的財務、投資、交易或其他類型的建議或推薦。請閱讀使用條款以了解更多資訊。