OPEN-SOURCE SCRIPT
已更新 Support Resistance - Dynamic v2 w/ Timeframe option
This script is a modification from the awesome "Support Resistance - Dynamic v2" by LonesomeTheBlue
https://www.tradingview.com/script/va09eWAp-Support-Resistance-Dynamic-v2/
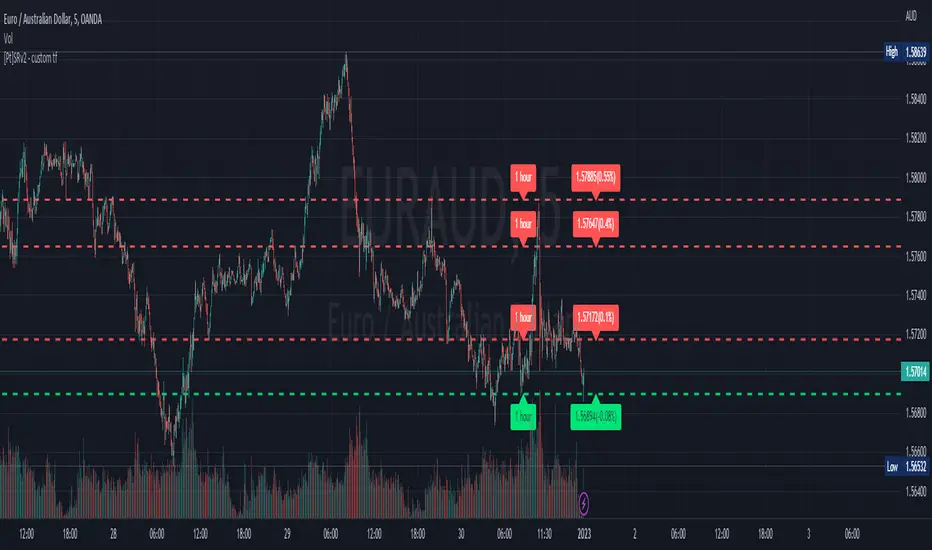
This script is very similar to the original indicator mentioned above, but with a modification that, in my opinion, would be very useful for many traders. It enables the option to choose different timeframe to calculate the S/R levels. Very often, traders would like to use higher timeframes to define S/R levels, rather than using the same timeframe that they are trading at. For example, if trading at 5min, we often use 15min, 30min or 1hr timeframe to define our S/R levels.
For example, below shows S/R levels from three different timeframes:
https://www.tradingview.com/x/HPFHcBty/
Hope you find value in this indicator~ Enjoy~
https://www.tradingview.com/script/va09eWAp-Support-Resistance-Dynamic-v2/
This script is very similar to the original indicator mentioned above, but with a modification that, in my opinion, would be very useful for many traders. It enables the option to choose different timeframe to calculate the S/R levels. Very often, traders would like to use higher timeframes to define S/R levels, rather than using the same timeframe that they are trading at. For example, if trading at 5min, we often use 15min, 30min or 1hr timeframe to define our S/R levels.
For example, below shows S/R levels from three different timeframes:
https://www.tradingview.com/x/HPFHcBty/
Hope you find value in this indicator~ Enjoy~
發行說明
Updated with additional display settings:- toggle display for labels
- Customizable label and text colors
Fixed bug on displaying 'H' and 'L' pivots
Attempted to fix the observation that S/R lines of the same timeframe are inconsistent on different chart timeframes. Improved slightly, but not completely fixed.
發行說明
Minor correction to typo in setting.發行說明
removed max limit on 'Pivot Period' and 'Maximum Number of Pivot' settings發行說明
Updated script to address the issue of lines not matching with lines generated at higher timeframe. Please note that this fix only works if the higher timeframe selected isn't "too far" away from the chart timeframe.Example:
發行說明
fixed bug from last update:- bug fixed: "Study Error - Error on bar 0. The study references too many candles in history" on non-intraday charts
開源腳本
秉持TradingView一貫精神,這個腳本的創作者將其設為開源,以便交易者檢視並驗證其功能。向作者致敬!您可以免費使用此腳本,但請注意,重新發佈代碼需遵守我們的社群規範。
Purchases / Subscriptions / Support - buymeacoffee.com/ptgambler
PayPal - paypal.me/PtGambler
You can reach me privately through my Discord Channel: discord.gg/WMQfaVGyQC
PayPal - paypal.me/PtGambler
You can reach me privately through my Discord Channel: discord.gg/WMQfaVGyQC
免責聲明
這些資訊和出版物並非旨在提供,也不構成TradingView提供或認可的任何形式的財務、投資、交易或其他類型的建議或推薦。請閱讀使用條款以了解更多資訊。