OPEN-SOURCE SCRIPT
已更新 Mark Minervini

Hi everyone,
Just sharing a script that I made when I began to be interested in Mark Minervini, Wiliam O'Neil, Nicolas Darvas,.. trading style.
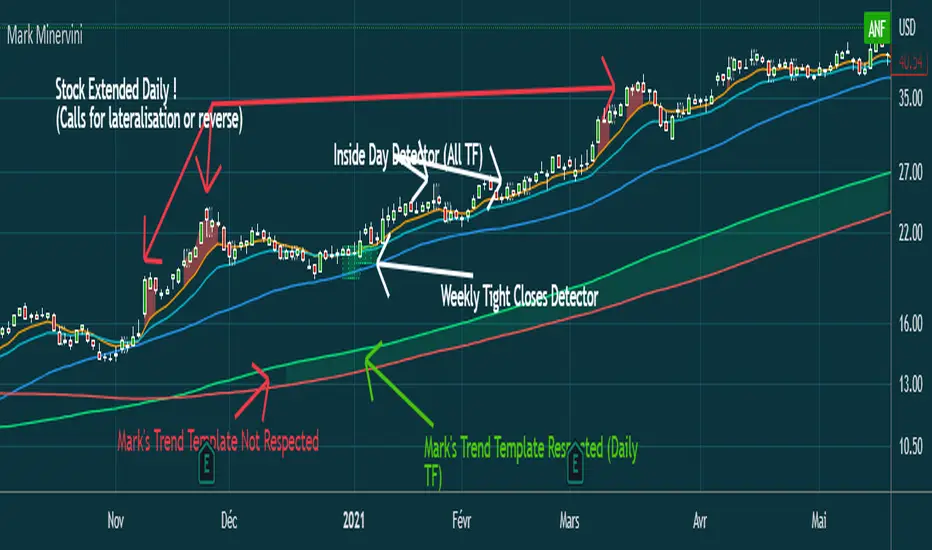
This script displays :
- 10 EMA (orange)
- 20 EMA (blue light)
- 50 SMA (blue)
-150 SMA (green)
-200 SMA (red)
- Shows when the stock is "extended" from EMA10 to high of the candle (Works in Daily, you can adjust the % to make it match with the stock's volatility)
(Shows a red area between price and 10 EMA)
- Shows when Mark Minervini's trend template is respected by highlighting green between 150 & 200 SMA.
I Although added bollinger bands and 5 EMA for very strong stocks. (I never use them)
Have fun
發行說明
Removed useless comments發行說明
Removed useless comments發行說明
- Removed indicators that were polluting the visual overview發行說明
- Added the possibility to display 3 Week Tight Closes to see potential accumulation (too confirm with low volume) and trade setup within STAGE 2 Market發行說明
- Modified the code to only make the extended color in Daily Graph- Improved a little bit the Weekly Tight Closes Detector
發行說明
'- Remove 'Trade'' by 'Trend' in the commentary發行說明
- Now possible to display inside bars on every time frame發行說明
- Changes Graph Exemple- Added the possibility to modify inside day color line
- Added a bigger size to double inside days
發行說明
- Modified Tight Closes so that they are :-> Auto-adaptable on every chart
-> Now very close to what we can see in Wiliam O'Neil's Book
-> Subtly indicated by soft boxes
-> Color can be modified in the parameters box
Honestly... I pulled myself up by my bootstraps, I'm really proud of the result ! Haha
發行說明
- Corrected a bug that appears in Da Graph due to Tight Closes Display發行說明
- Extended Price are now auto-adaptive發行說明
- Changed the green lines by boxes using box.new()- Coloured inside the lines of the inside days
- Added some comments and reorganised the code a little
發行說明
Re-organised position and feature's names發行說明
- Added comment in english regarde the 52We part (It was in French before)- Added the Mark Minervini Trend Template in comments from "Trade Like a Stock Market Wizard"
發行說明
- Now Inside Days and Tight Closes are thinner- Removed the bolinger bands
- Added the 10 SMA in red, now possible to display it
- Adjusted the box arround Weekly Tight Closes
發行說明
- Arranged Inputs- Now Extended Daily displays only in Daily TF
- Now Weekly Tight Closes displays only in We
- Now possible to change color of the area when trend template criteria are met
發行說明
- The trend template is now displayed in Daily only發行說明
- Went from Pine Script v4 to v5- Added optional Peak/Valley points
發行說明
- You can now display % variation of Peak/Valley points發行說明
- You can now adjust color of the SMA/EMA- Optimized the code a little bit
開源腳本
秉持TradingView一貫精神,這個腳本的創作者將其設為開源,以便交易者檢視並驗證其功能。向作者致敬!您可以免費使用此腳本,但請注意,重新發佈代碼需遵守我們的社群規範。
免責聲明
這些資訊和出版物並非旨在提供,也不構成TradingView提供或認可的任何形式的財務、投資、交易或其他類型的建議或推薦。請閱讀使用條款以了解更多資訊。
開源腳本
秉持TradingView一貫精神,這個腳本的創作者將其設為開源,以便交易者檢視並驗證其功能。向作者致敬!您可以免費使用此腳本,但請注意,重新發佈代碼需遵守我們的社群規範。
免責聲明
這些資訊和出版物並非旨在提供,也不構成TradingView提供或認可的任何形式的財務、投資、交易或其他類型的建議或推薦。請閱讀使用條款以了解更多資訊。