OPEN-SOURCE SCRIPT
已更新 Volatility Visualizer by Oddbeaker LLC
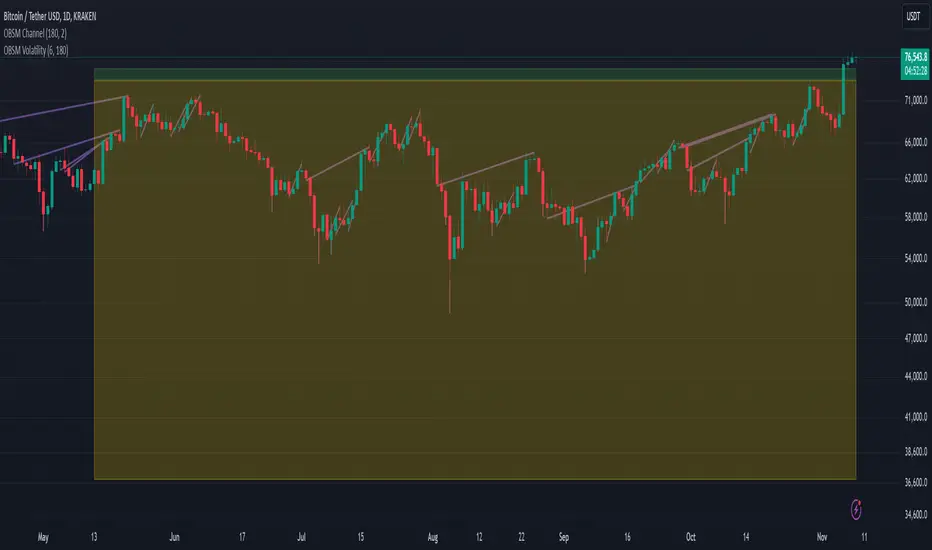
Use this to determine if a crypto pair has volatility suitable for your Oddbeaker Synthetic Miner. Draws entry/exit lines over the candles.
Inputs:
Notes:
Tips:
- "Show me every place on the chart where I could have made X percent gains in Y days or less."
Inputs:
- Percent Gain: Minimum percent gains to show on the chart.
- Scan Bars: Maximum number of bars allowed to reach the profit target.
Notes:
- Lines drawn on the chart indicate the entry and exit times and prices to reach the exact profit target.
- The indicator only uses the low price of each candle to determine entry. It does not show every possible entry point.
- When counting lines, count any group of lines that cross each other as one. Also, count any group of lines that do not cross but overlap in price over the same time period as one.
Tips:
- For best results, set Percent Gain to double the amount of the sum of Min Profit and Min Stash on your Synth Miner. Example: If you have minProfit=5 and minStash=5, 5+5=10, so percentGain should be 20 on the chart.
- Use a daily chart and set Scan Bars to 7 or less on highly volatile pairs.
- Look for charts with the highest number of lines that don't overlap.
- Use this indicator combined with the Synthetic Mining Channel for best results.
發行說明
2024-02-29- Added Line Color input, which I thought I had already done.
發行說明
- Indicator now shows single candles with a range larger than the percentGain
- Changed the default percentGain to 2
- Changed default line color and increased thickness
開源腳本
秉持TradingView一貫精神,這個腳本的創作者將其設為開源,以便交易者檢視並驗證其功能。向作者致敬!您可以免費使用此腳本,但請注意,重新發佈代碼需遵守我們的社群規範。
免責聲明
這些資訊和出版物並非旨在提供,也不構成TradingView提供或認可的任何形式的財務、投資、交易或其他類型的建議或推薦。請閱讀使用條款以了解更多資訊。
開源腳本
秉持TradingView一貫精神,這個腳本的創作者將其設為開源,以便交易者檢視並驗證其功能。向作者致敬!您可以免費使用此腳本,但請注意,重新發佈代碼需遵守我們的社群規範。
免責聲明
這些資訊和出版物並非旨在提供,也不構成TradingView提供或認可的任何形式的財務、投資、交易或其他類型的建議或推薦。請閱讀使用條款以了解更多資訊。