OPEN-SOURCE SCRIPT
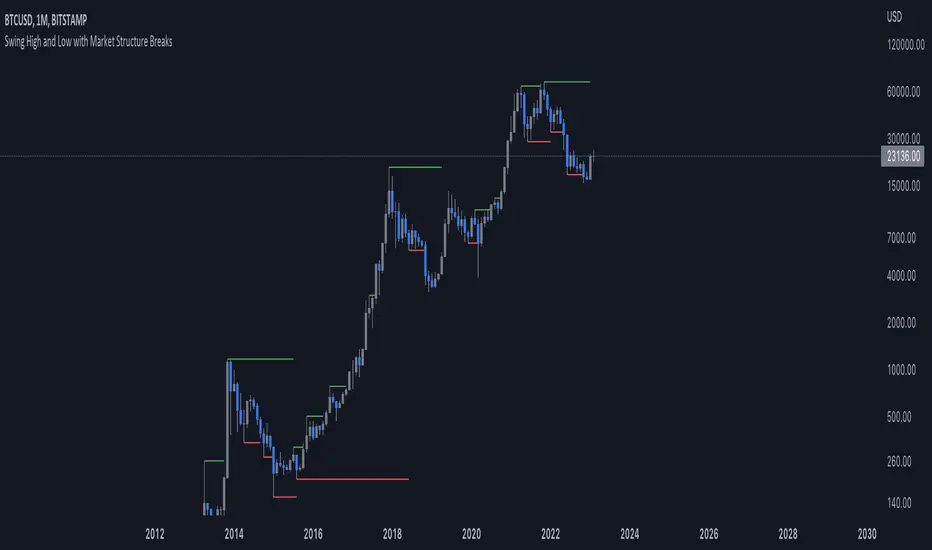
Simple Market Structure

This indicator is meant for education and experimental purposes only.
Many Market Structure Script out there isn't open-sourced and some could be complicated to understand to modify the code. Hence, I published this code to make life easier for beginner programmer like me to modify the code to fit their custom indicator.
As I am not a expert or pro in coding it might not be as accurate as other reputable author.
Any experts or pros that is willing to contribute this code in the comment section below would be appreciated, I will modify and update the script accordingly as part of my learning journey.
It is useful to a certain extend to detect Market Structure using Swing High/Low in all market condition.
Here are some points that I am looking to improve / fix:
Any suggested improvement, please do let me know in the comment section below and I will try my best to implement it into the script.
Many Market Structure Script out there isn't open-sourced and some could be complicated to understand to modify the code. Hence, I published this code to make life easier for beginner programmer like me to modify the code to fit their custom indicator.
As I am not a expert or pro in coding it might not be as accurate as other reputable author.
Any experts or pros that is willing to contribute this code in the comment section below would be appreciated, I will modify and update the script accordingly as part of my learning journey.
It is useful to a certain extend to detect Market Structure using Swing High/Low in all market condition.
Here are some points that I am looking to improve / fix:
- To fix certain horizontal lines that does not paint up to the point where it breaks through.
- To add in labels when a market structure is broken.
- Allow alerts to be sent when market structure is broken (Probably be done in the last few updates after knowing it is stable and as accurate as possible)
Any suggested improvement, please do let me know in the comment section below and I will try my best to implement it into the script.
開源腳本
秉持TradingView一貫精神,這個腳本的創作者將其設為開源,以便交易者檢視並驗證其功能。向作者致敬!您可以免費使用此腳本,但請注意,重新發佈代碼需遵守我們的社群規範。
免責聲明
這些資訊和出版物並非旨在提供,也不構成TradingView提供或認可的任何形式的財務、投資、交易或其他類型的建議或推薦。請閱讀使用條款以了解更多資訊。
開源腳本
秉持TradingView一貫精神,這個腳本的創作者將其設為開源,以便交易者檢視並驗證其功能。向作者致敬!您可以免費使用此腳本,但請注意,重新發佈代碼需遵守我們的社群規範。
免責聲明
這些資訊和出版物並非旨在提供,也不構成TradingView提供或認可的任何形式的財務、投資、交易或其他類型的建議或推薦。請閱讀使用條款以了解更多資訊。