OPEN-SOURCE SCRIPT
UpVol/TVol NYSE Lowry Upside Days
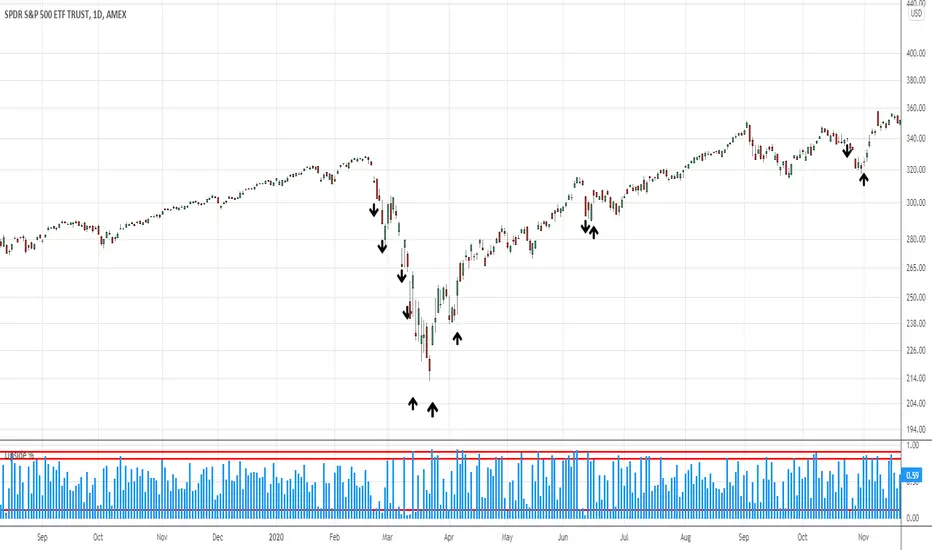
Takes Tradingviews Upside Volume for NYSE and divides it by Total Volume on NYSE.
Tradingview's data source generally has different volume figures than say the Wall Street Journal. Therefore, this indicator is an estimate.
10% upside volume shows extreme panic and is consistent with market sell offs.
90% upside days, following a decline, are often occur within a week or so of significant market bottoms.
Recommend using columns as the plot type.
Based on research of LowryResearch Corp.
開源腳本
秉持TradingView一貫精神,這個腳本的創作者將其設為開源,以便交易者檢視並驗證其功能。向作者致敬!您可以免費使用此腳本,但請注意,重新發佈代碼需遵守我們的社群規範。
Cory Mitchell, CMT
Stock and forex trading insights at tradethatswing.com/
Stock and forex trading insights at tradethatswing.com/
免責聲明
這些資訊和出版物並非旨在提供,也不構成TradingView提供或認可的任何形式的財務、投資、交易或其他類型的建議或推薦。請閱讀使用條款以了解更多資訊。