OPEN-SOURCE SCRIPT
Mr. Laz's Fibonacci MA
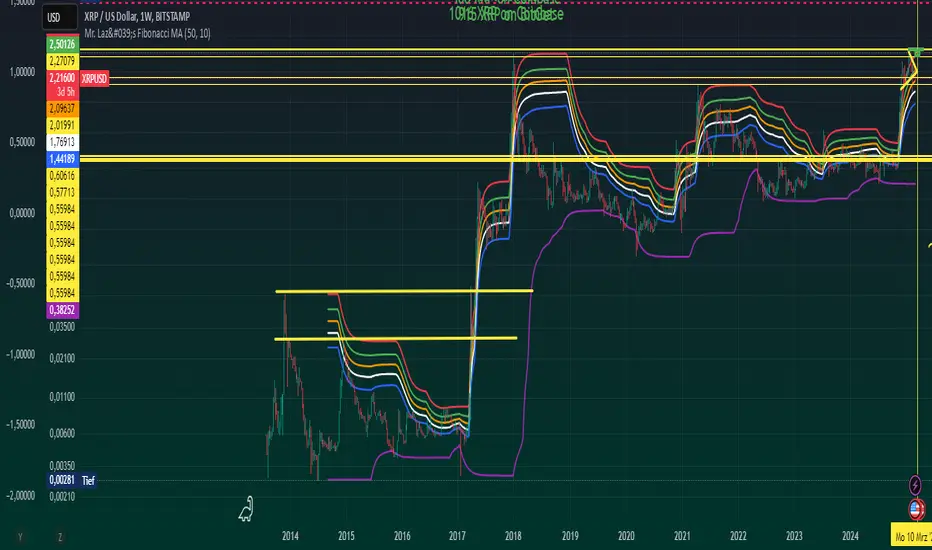
Smoothed Fibonacci Moving Average
This indicator plots six Fibonacci retracement levels overlaid on the chart, with each level smoothly adjusted using an Exponential Moving Average (EMA). The Fibonacci levels are calculated based on the highest high and lowest low over a user-defined period, and they represent key support and resistance zones that traders often watch for price reversals.
The six Fibonacci retracement levels plotted are:
0% (Fib 0): Top level (representing the highest point in the range).
23.6% (Fib 23.6%)
38.2% (Fib 38.2%)
50% (Fib 50%)
61.8% (Fib 61.8%)
100% (Fib 100): Bottom level (representing the lowest point in the range).
These levels are smoothed using a user-defined Smoothing Length, which helps reduce the "zig-zag" nature of the lines and provides a more gradual, smoother appearance as they follow the price movement. The indicator allows you to adjust the smoothing factor to control how sensitive the lines are to price changes.
The colors of the Fibonacci levels are customizable and are plotted from top to bottom as:
Red (for Fib 100%)
Green (for Fib 23.6%)
Orange (for Fib 38.2%)
White (for Fib 50%)
Blue (for Fib 61.8%)
Purple (for Fib 0%)
This indicator is useful for identifying key support and resistance zones based on Fibonacci retracement levels, with the added benefit of smoothing to make the lines more visually appealing and less prone to sudden shifts.
開源腳本
秉持TradingView一貫精神,這個腳本的創作者將其設為開源,以便交易者檢視並驗證其功能。向作者致敬!您可以免費使用此腳本,但請注意,重新發佈代碼需遵守我們的社群規範。
免責聲明
這些資訊和出版物並非旨在提供,也不構成TradingView提供或認可的任何形式的財務、投資、交易或其他類型的建議或推薦。請閱讀使用條款以了解更多資訊。
開源腳本
秉持TradingView一貫精神,這個腳本的創作者將其設為開源,以便交易者檢視並驗證其功能。向作者致敬!您可以免費使用此腳本,但請注意,重新發佈代碼需遵守我們的社群規範。
免責聲明
這些資訊和出版物並非旨在提供,也不構成TradingView提供或認可的任何形式的財務、投資、交易或其他類型的建議或推薦。請閱讀使用條款以了解更多資訊。