OPEN-SOURCE SCRIPT
Candle % Close with Bullish/Bearish Evaluation
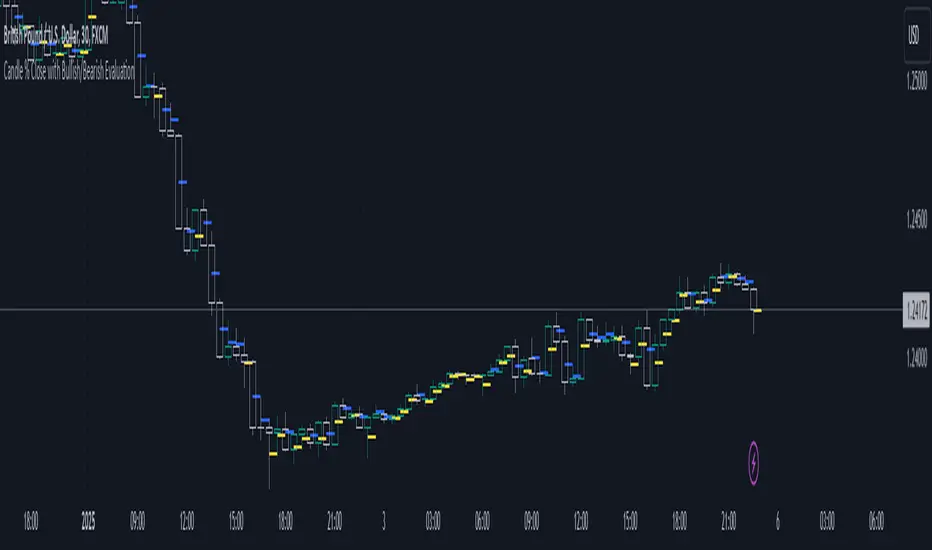
I created the indicator to more quickly define the polarity of candles. For a large number of candles, it is straightforward to determine whether a candle is bullish or bearish. However, candles with long wicks often appear, making it uncertain whether the candle is bullish or bearish from a price action perspective. It is not a rule that a red candle is bearish and a green candle is bullish.
From a more advanced price action standpoint, how these candles close is important. Therefore, I created the 'Percent range' input. By default, it is set to 50% (high-low)/2. This way, the indicator precisely determines 50% of the candle's entire range. This allows us to determine whether a bearish candle truly closed below 50% of its range. If not, such a candle is considered bullish, even if it is a negative candle. The same applies to bullish candles, but conversely. If a positive candle closes below 50% of its range, from a price action perspective, it is considered a bearish candle.
Since in price action it is common for the price to return to 50% of the previous candle and, after filling, to continue in the established trend, I added the line extension option. Whatever high value you enter, the line extension follows the current candle. This option works only when the stop line checkbox is enabled. This way, you can plot 50% of the candle's range that the market has historically not returned to due to a strong trend. Often, this line is plotted on a candle where there is also an FVG, which can help you more easily find a point of interest.
Stop line extension: Ensures the interruption of line plotting when the candle is touched by the body or wick.
開源腳本
秉持TradingView一貫精神,這個腳本的創作者將其設為開源,以便交易者檢視並驗證其功能。向作者致敬!您可以免費使用此腳本,但請注意,重新發佈代碼需遵守我們的社群規範。
免責聲明
這些資訊和出版物並非旨在提供,也不構成TradingView提供或認可的任何形式的財務、投資、交易或其他類型的建議或推薦。請閱讀使用條款以了解更多資訊。
開源腳本
秉持TradingView一貫精神,這個腳本的創作者將其設為開源,以便交易者檢視並驗證其功能。向作者致敬!您可以免費使用此腳本,但請注意,重新發佈代碼需遵守我們的社群規範。
免責聲明
這些資訊和出版物並非旨在提供,也不構成TradingView提供或認可的任何形式的財務、投資、交易或其他類型的建議或推薦。請閱讀使用條款以了解更多資訊。