OPEN-SOURCE SCRIPT
已更新 Pivot Points
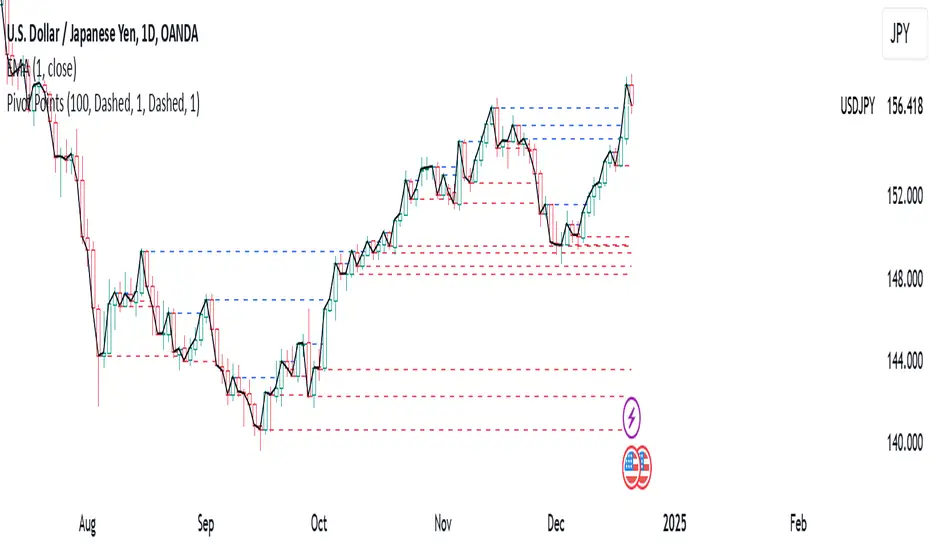
Pivot Points Indicator
The Pivot Points indicator highlights areas on the chart where candles close in opposite colors. These points occur when the price shifts from bullish to bearish, or vice versa, indicating potential reversals or continuation patterns. These points are more easily seen on a line chart and represent areas where the price changes direction to create peak formations.
Foundational Concepts
Before diving into the indicator, it’s important to understand a few key concepts:
When price is trending upward, it creates higher highs and higher lows. Each high or low acts as a pivot point. In an uptrend, the price is more likely to break the previous high (pivot point) and continue higher. You can enter a buy trade when the price breaks the previous high, anticipating the continuation of the trend.
When price is trending downward, it creates lower lows and lower highs. Each high or low is also a pivot point. In a downtrend, the price is more likely to break the previous low (pivot point) and continue lower. You can enter a sell trade when the price breaks the previous low, anticipating the continuation of the trend.
For reversal trades, it’s helpful to be familiar with chart patterns like double tops, double bottoms, and head and shoulders. The Pivot Points indicator can assist in identifying these patterns, helping you determine entry points, as well as where to place your stop loss.
Recommended Setup
It’s recommended to have two charts open side by side: one displaying a line chart and the other showing a candlestick chart, with the Pivot Points indicator applied to both. This setup allows you to easily identify the market structure and price action as it approaches these levels. You can also add a 20-period Simple Moving Average (SMA) to both charts to help identify the overall trend. Additionally, consider adding the Relative Strength Index (RSI) to the line chart to confirm overbought or oversold conditions.
This approach can be used on any timeframe.
Contributing
If you have suggestions, improvements, or bug fixes, I encourage you to submit pull requests. Collaboration helps make the indicator more versatile and useful for everyone.
Disclaimer
Any trading decisions you make are entirely your responsibility.
The MetaTrader 5 version of this indicator is available on my GitHub repository: roshaneforde/pivot-points-indicator
發行說明
Pivot Points IndicatorThe Pivot Points indicator highlights areas on the chart where candles close in opposite colors. These points occur when the price shifts from bullish to bearish, or vice versa, indicating potential reversals or continuation patterns. These points are more easily seen on a line chart and represent areas where the price changes direction to create peak formations.
Foundational Concepts
Before diving into the indicator, it’s important to understand a few key concepts:
When price is trending upward, it creates higher highs and higher lows. Each high or low acts as a pivot point. In an uptrend, the price is more likely to break the previous high (pivot point) and continue higher. You can enter a buy trade when the price breaks the previous high, anticipating the continuation of the trend.
When price is trending downward, it creates lower lows and lower highs. Each high or low is also a pivot point. In a downtrend, the price is more likely to break the previous low (pivot point) and continue lower. You can enter a sell trade when the price breaks the previous low, anticipating the continuation of the trend.
For reversal trades, it’s helpful to be familiar with chart patterns like double tops, double bottoms, and head and shoulders. The Pivot Points indicator can assist in identifying these patterns, helping you determine entry points, as well as where to place your stop loss.
Recommended Setup
It’s recommended to have two charts open side by side: one displaying a line chart and the other showing a candlestick chart, with the Pivot Points indicator applied to both. This setup allows you to easily identify the market structure and price action as it approaches these levels. You can also add a 20-period Simple Moving Average (SMA) to both charts to help identify the overall trend. Additionally, consider adding the Relative Strength Index (RSI) to the line chart to confirm overbought or oversold conditions.
This approach can be used on any timeframe.
Contributing
If you have suggestions, improvements, or bug fixes, I encourage you to submit pull requests. Collaboration helps make the indicator more versatile and useful for everyone.
Disclaimer
Any trading decisions you make are entirely your responsibility.
The MetaTrader 5 version of this indicator is available on my GitHub repository: roshaneforde/pivot-points-indicator
發行說明
Revert to the previous version發行說明
Update the number of candles to draw on開源腳本
秉持TradingView一貫精神,這個腳本的創作者將其設為開源,以便交易者檢視並驗證其功能。向作者致敬!您可以免費使用此腳本,但請注意,重新發佈代碼需遵守我們的社群規範。
免責聲明
這些資訊和出版物並非旨在提供,也不構成TradingView提供或認可的任何形式的財務、投資、交易或其他類型的建議或推薦。請閱讀使用條款以了解更多資訊。
開源腳本
秉持TradingView一貫精神,這個腳本的創作者將其設為開源,以便交易者檢視並驗證其功能。向作者致敬!您可以免費使用此腳本,但請注意,重新發佈代碼需遵守我們的社群規範。
免責聲明
這些資訊和出版物並非旨在提供,也不構成TradingView提供或認可的任何形式的財務、投資、交易或其他類型的建議或推薦。請閱讀使用條款以了解更多資訊。