OPEN-SOURCE SCRIPT
已更新 Lines of Chaos (ATR/ADR Levels)
Lines of Chaos Indicator
This script is designed to provide traders with ATR (Average True Range) and ADR (Average Daily Range) support and resistance levels.
How it Works:
Key Features:
How to Use:
This script is designed to provide traders with ATR (Average True Range) and ADR (Average Daily Range) support and resistance levels.
How it Works:
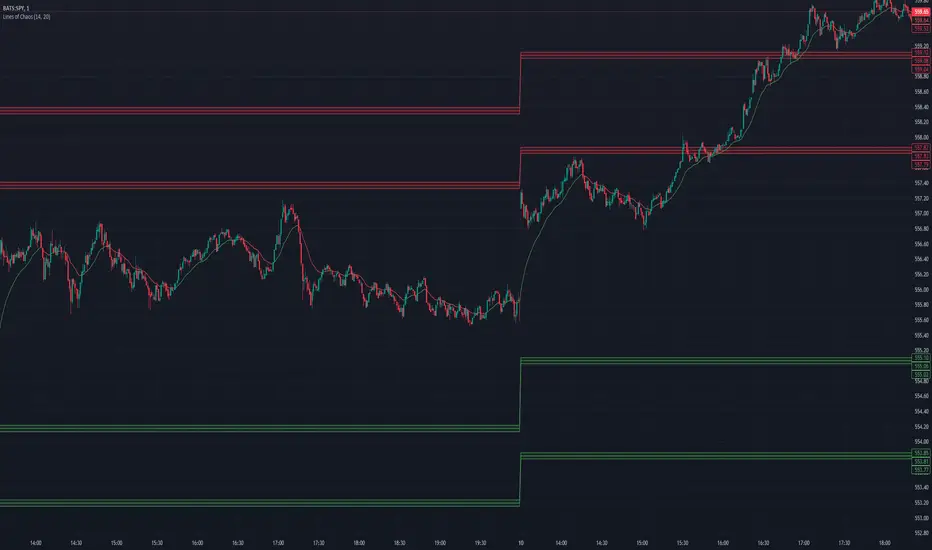
- Support and Resistance Lines: The script plots ATR/ADR-based support and resistance lines based on a moving average of the last ATR/ADR Length days, the previous day's close, and the current day's open. Changing the ATR/ADR Length value changes the number of days of data to average.
- EMA: The EMA is colored red when the ticker is potentially bearish. The EMA is colored green when the ticker is potentially bullish. Changing the EMA Length changes the number of data bars to average.
- Default Settings: The default settings are optimized for most trading environments.
Key Features:
- ATR & ADR Calculation: You can use ATR, ADR, or both. ATR is recommended for most scenarios.
- Customizable Lengths: Adjust the ATR/ADR Length to refine the average calculation to your preference, with 14 being the standard value.
- EMA for Market Bias: The EMA helps determine the ticker bias. It is colored green when the market is above the average price and red when below. This allows you to more easily determine whether or not the ADR/ATR levels are valid.
- Versatile Usage: Suitable for various trading types, ensuring broad applicability across different market conditions.
How to Use:
- Bounces off Levels: When the price bounces off a support/resistance level, the price will likely respect this level. This indicates that the price is unlikely to exceed the ticker's average volatility.
- Breakthroughs of Levels: When the price breaks through a support/resistance level, the price will likely continue beyond this level. This indicates that the price has moved beyond that ticker's average volatility.
發行說明
- Added Support and Resistance Zones to make bounces/breakthroughs easier to spot when not directly on the line
- Refactored code
發行說明
- Zone Range Percentage Setting: You can now change the zone range percentage. The zone range percentage controls the size of the zones for each support/resistance level. The default of 1 (1% above, 1% below) is recommended.
- Support/Resistance Lines are now hidden by default in favor of Support/Resistance Zones
- Support/Resistance Zone Lines now have a thickness of 2 by default
開源腳本
秉持TradingView一貫精神,這個腳本的創作者將其設為開源,以便交易者檢視並驗證其功能。向作者致敬!您可以免費使用此腳本,但請注意,重新發佈代碼需遵守我們的社群規範。
免責聲明
這些資訊和出版物並非旨在提供,也不構成TradingView提供或認可的任何形式的財務、投資、交易或其他類型的建議或推薦。請閱讀使用條款以了解更多資訊。
免責聲明
這些資訊和出版物並非旨在提供,也不構成TradingView提供或認可的任何形式的財務、投資、交易或其他類型的建議或推薦。請閱讀使用條款以了解更多資訊。