INVITE-ONLY SCRIPT
TradeChartist TrendStalker - Market Bias Indicator
™TradeChartist TrendStalker helps visualise the Market Bias through 3 different Plot types and also displays Trend Direction Identifier (Green, Red and Orange square blocks) that can be connected to ™TradeChartist Plug and Trade to generate Trade entries, Targets, StopLoss and create alerts based on performance on the chosen timeframe. The three plot types are as below.
1. Market Bias Strength Oscillator
Plots true strength of Market Bias - helps determine if Market is Bullish/Bearish overall for the asset on chart TF.
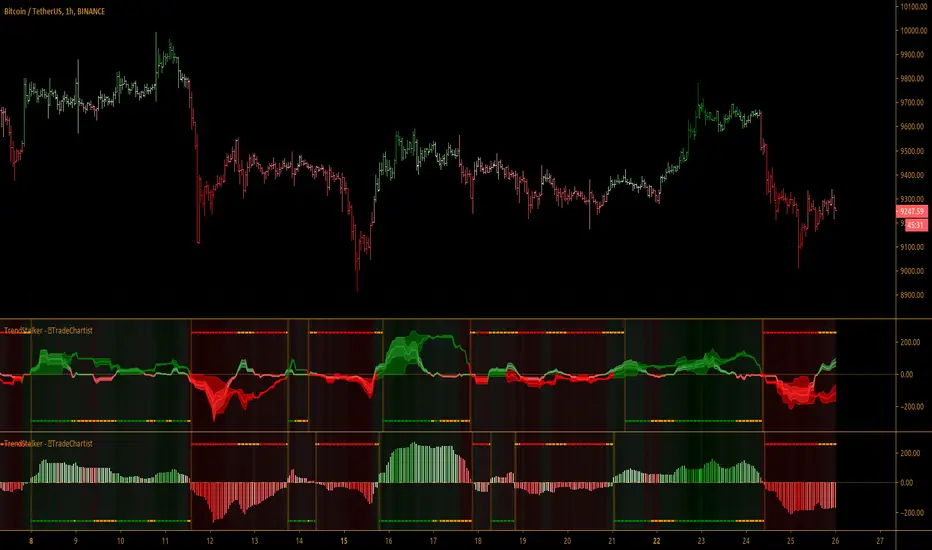
2. Market Bias Detector - Range Based
Displays TrendStalker plots stalking the Market Bias based on Range the Market is expecting to gain/lose from the asset on the Chart Timeframe. Change in Market Bias can be easily seen through the Convergence/Divergence of the TrendStalker plots.
3. Market Bias Detector - Price
Displays TrendStalker plots stalking the Market Bias based on Price for the asset on the Chart Timeframe. Change in Market Bias can be easily seen through the Convergence/Divergence of the TrendStalker plots.
Note: Trend Direction Identifier for Trade entries will be the same for Market Bias Detector plots, but differs from Market Bias Strength Oscillator.
Note: Trend Direction Identifier plots orange squares when its detecting a potential change in trend and its recommended to close some/most of the position or move Stop Loss to protect profit/reduce risk. Once the orange squares turn back into green/red squares, it signals safe re-entry.
Green squares - Bullish Trend
Red Squares - Bearish Trend
Orange Squares - Potential change in Market Bias
===================================================================================================================
TrendStalker Cool Extras
BTC 1hr Chart with TrendStalker Extras

===================================================================================================================
BTC 1hr Chart with TrendStalker connected to ™TradeChartist Plug and Trade

===================================================================================================================
This is not a free to use indicator. Get in touch with me (PM me directly if you would like trial access to test the indicator)
Premium Scripts - Trial access and Information
===================================================================================================================
1. Market Bias Strength Oscillator
Plots true strength of Market Bias - helps determine if Market is Bullish/Bearish overall for the asset on chart TF.
2. Market Bias Detector - Range Based
Displays TrendStalker plots stalking the Market Bias based on Range the Market is expecting to gain/lose from the asset on the Chart Timeframe. Change in Market Bias can be easily seen through the Convergence/Divergence of the TrendStalker plots.
3. Market Bias Detector - Price
Displays TrendStalker plots stalking the Market Bias based on Price for the asset on the Chart Timeframe. Change in Market Bias can be easily seen through the Convergence/Divergence of the TrendStalker plots.
Note: Trend Direction Identifier for Trade entries will be the same for Market Bias Detector plots, but differs from Market Bias Strength Oscillator.
Note: Trend Direction Identifier plots orange squares when its detecting a potential change in trend and its recommended to close some/most of the position or move Stop Loss to protect profit/reduce risk. Once the orange squares turn back into green/red squares, it signals safe re-entry.
Green squares - Bullish Trend
Red Squares - Bearish Trend
Orange Squares - Potential change in Market Bias
===================================================================================================================
TrendStalker Cool Extras
- Option to paint Background Color
- Option to enable Take Profit bar recommendation (Works only with Market Bias Strength Oscillator)
- Option to paint Price Bars using Market Bias Strength
- Alerts can be created for Long/Short Entry/Re-entry and Long/Short SOS signals (Orange squares). For all other alerts, ™TradeChartist Plug and Trade can be used.
BTC 1hr Chart with TrendStalker Extras
===================================================================================================================
BTC 1hr Chart with TrendStalker connected to ™TradeChartist Plug and Trade
===================================================================================================================
This is not a free to use indicator. Get in touch with me (PM me directly if you would like trial access to test the indicator)
Premium Scripts - Trial access and Information
- Trial access offered on all Premium scripts.
- PM me directly to request trial access to the scripts or for more information.
===================================================================================================================
僅限邀請腳本
僅限作者授權的用戶訪問此腳本,並且通常需要付費。您可以將其增加到收藏腳本中,但是只有在向作者請求並獲得許可之後,才能使用它。 請聯繫TradeChartist以了解更多信息,或按照下面作者的說明進行操作。
TradingView 不建議購買並使用此腳本,除非您 100% 信任其作者並了解腳本的工作原理。在許多情況下,您可以在我們的社群腳本中免費找到良好的開源替代方案。
作者的說明
″
想在圖表上使用此腳本?
警告:請閱讀,然後再請求訪問權限。
Get in touch with me if you would like access to my Premium scripts for a trial before deciding on lifetime access.
Telegram - @Trade_Chartist
Free Scripts - bit.ly/Free-Scripts
Telegram - @Trade_Chartist
Free Scripts - bit.ly/Free-Scripts
免責聲明
這些資訊和出版物並不意味著也不構成TradingView提供或認可的金融、投資、交易或其他類型的意見或建議。請在使用條款閱讀更多資訊。