OPEN-SOURCE SCRIPT
已更新 Fear and Greed Indicator [DunesIsland]
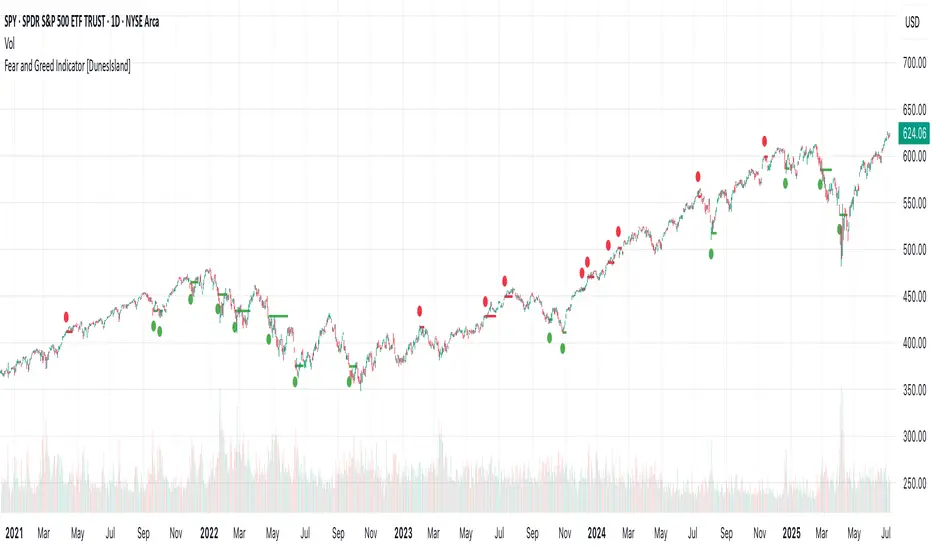
The Fear and Greed Indicator [DunesIsland] is a TradingView indicator that measures market sentiment using five metrics. It displays:
Purpose: Helps traders spot market extremes for contrarian trading opportunities.Components (each weighted 20%):
Alerts:
- Tiny green circles below candles when the market is in "Extreme Fear" (index ≤ 25), signalling potential buys.
- Tiny red circles above candles when the market is in "Greed" (index > 75), indicating potential sells.
Purpose: Helps traders spot market extremes for contrarian trading opportunities.Components (each weighted 20%):
- Market Momentum: S&P 500 (SPX) vs. its 125-day SMA, normalized over 252 days.
- Stock Price Strength: Net NYSE 52-week highs (INDEX:HIGN) minus lows (INDEX:LOWN), normalized.
- Put/Call Ratio: 5-day SMA of Put/Call Ratio (USI:PC).
- Market Volatility: VIX (VIX), inverted and normalized.
- Stochastic RSI: 14-period RSI on SPX with 3-period Stochastic SMA.
Alerts:
- Buy: Index ≤ 25 ("Extreme Fear - Potential Buy").
- Sell: Index > 75 ("Greed - Potential Sell").
發行說明
The updated script includes several key improvements, making it more accurate and user-friendly:- Smarter Shape Plotting: In the original script, circles might have appeared on every bar where the fear or greed condition was met, cluttering the chart. Now, circles are only plotted at the start of a new fear or greed period, clearly marking the moment to consider a buy or sell opportunity.
- Improved Line Persistence: Previously, if the condition was met for just one bar, the horizontal line might not have displayed correctly. The updated version ensures that the line extends for a total of 5 bars (including the trigger bar), providing consistent visual feedback even for short-lived signals.
- Better Retrigger Handling: The original script struggled with retriggers—when the condition was met, unmet, and met again in quick succession. Now, the script dynamically adjusts: for example, if the condition triggers on one bar, stops, and triggers again later, the line starts at the first trigger’s close and extends for 5 bars after the last trigger. This ensures the indicator accurately reflects evolving market sentiment.
These changes make the Fear and Greed Indicator more reliable and easier to read, offering clearer signals for potential trading opportunities.
發行說明
Updated Chart開源腳本
秉持TradingView一貫精神,這個腳本的創作者將其設為開源,以便交易者檢視並驗證其功能。向作者致敬!您可以免費使用此腳本,但請注意,重新發佈代碼需遵守我們的社群規範。
免責聲明
這些資訊和出版物並非旨在提供,也不構成TradingView提供或認可的任何形式的財務、投資、交易或其他類型的建議或推薦。請閱讀使用條款以了解更多資訊。
開源腳本
秉持TradingView一貫精神,這個腳本的創作者將其設為開源,以便交易者檢視並驗證其功能。向作者致敬!您可以免費使用此腳本,但請注意,重新發佈代碼需遵守我們的社群規範。
免責聲明
這些資訊和出版物並非旨在提供,也不構成TradingView提供或認可的任何形式的財務、投資、交易或其他類型的建議或推薦。請閱讀使用條款以了解更多資訊。