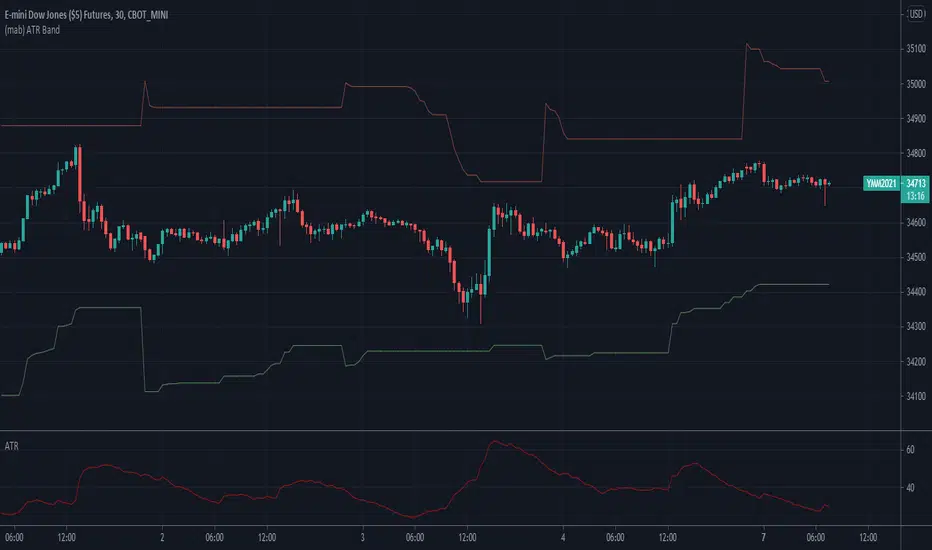
NNFX ATRBefore I begin I want to mention:
1. This is an indicator specially made for NNFX traders who use the ATR rule of ATR1x for Take Profit and ATR1.5x for Stop Loss
2. It is a product of combining the in-built ATR and Dillon Grech's ATR ()
The indicator:
1. It can be used for a quick look using the lines to see instead of calculating whether price hit a TP or SL. However I have kept the Main ATR for those who want to record the ATR into the spreadsheet when back testing or forward testing
2. When placing a buy/long order, TP is blue and appears above price, SL is red and appears below price
3. When placing a sell/short order, TP is blue and appears below price, SL is red and appears above price
4. The Main ATR, which is yellow, is way below price because I didn't want the chart to be overwhelmed by a 5th line in the middle of 2 TPs and SLs aka make the chart look claustrophobic
ATR
ATR Start & Stop BotThis script is using Average True Range (ATR) and works very well on the Bitcoin 4 hour timeframe to determine when to stop and start your bots.
It has a very similar visual to the EMA RSI Indicator found here:
This 'ATR Start & Stop Bot' is better because it has less confusion during sideways market movement.
As an example - You are using 3commas and have a Composite bot setup with several alt coins, you can use this indicator with the ' Stop bot ' alert to disable your composite bot from taking trades at times when the market is on a trend that looks in the red.
Alternatively you can use the ' Start bot ' alert to turn your bot back on during the green uptrends.
Using this indicator with these alerts on the Bitcoin 4-Hour chart add a great layer of automation to your already existing bots.
Credits:
Original 'ATR Stops' indicator belong to the user failathon and that script is found here:
Also credits to Dradian for the alert additions.

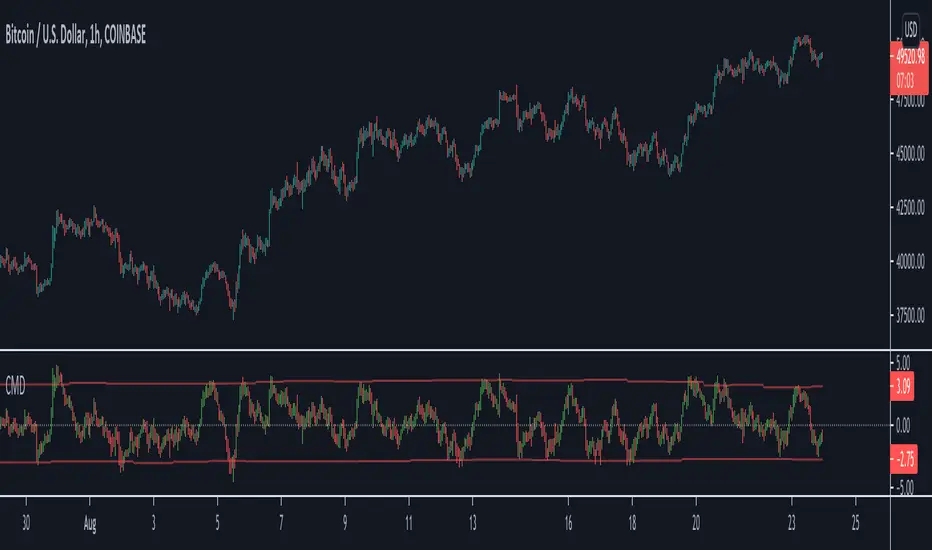
Study: Candle MA Distance (ATR)Simple script that plots price to MA distance (ATR) as a bar chart.
ATR is being used here instead of % because ATR keeps it relative to current volatility (1ATR move in either direction can have very different % for when price at 20cent and 2 dollars).
Upper/Lower band is calculated based on the average of previous peak/trough. Price approaching the band could signal overextended in the short term movement, expect price to consolidate/retrace to the MA.
Caution: if the indicator shows the price "pulled back" to MA, the actual price could still go up (or down), just a little slower then the MA
Adjustable Settings:
- Plot as bar or line
- MA Type and Length
- ATR Length
█ Disclaimer
Past performance is not an indicator of future results.
My opinions and research are my own and do not constitute financial advice in any way whatsoever.
Nothing published by me constitutes an investment recommendation, nor should any data or Content published by me be relied upon for any investment/trading activities.
I strongly recommends that you perform your own independent research and/or speak with a qualified investment professional before making any financial decisions.
SuperTrend+ DuoUses two SuperTrend+ indicators to signal when a change in trend is confirmed.
By using a minor trend within the major, a pullback after a turning point can signal a more optimal entry.
See SuperTrend+ for more details.

Timeweighted Colored VWAP with SlopeHey, traders!
This script calculates the VWAP's change rate against ATR in a number of k-lines. It controls the VWAP line's color based on the average change rate, and it changes its color in a time-weighted way.
1. Calculating vwapValue's rate of change
2. Controlling Line's color based on the average change rate against ATR
3. Calculating average change rate in the past k-lines
K线的数量:计算多少根K线的VWAP值的变化率的平均值,相当于用K线的数量来时间加权
变化率阈值:线条颜色变化的阈值,VWAP值的变化率比这个大或者小时改变颜色,否则延续原来的颜色
Good luck with your trading!

SD - Average True Range v5 - DoubleSD - Average True Range - Daily Weekly Monthly Yearly v5
It gives ATR intervals as 4 hours, daily, weekly, monthly and yearly. The expectation is to fill the ATR targets within the specified ranges. It can be used to determine target points on charts with a clear direction on the train.
Unlike the previous version, it is provided to use 2 different periods in the same indicator.
Note: Developed based on the source codes of the original SD ADR indicator.

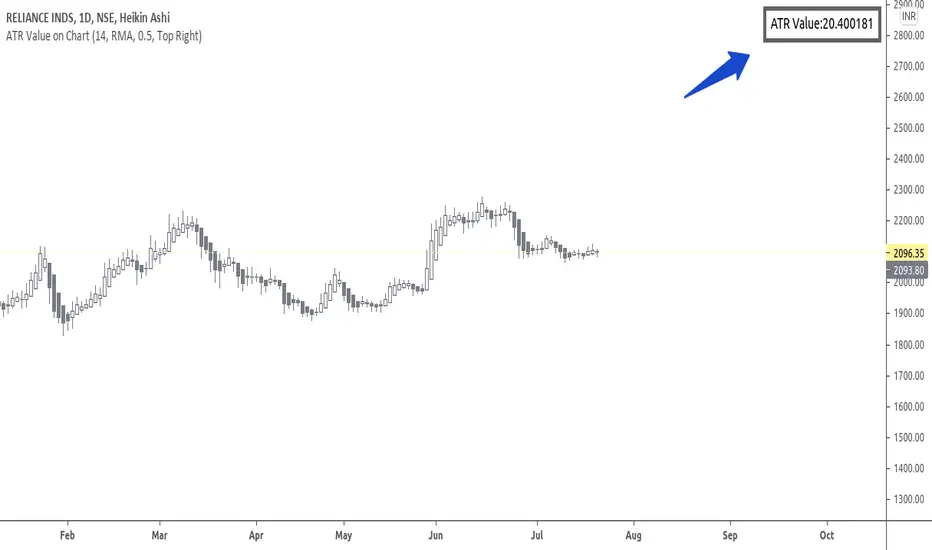
ATR Value on ChartHi Friends & TradingView community.
Greetings to you.
Many traders use ATR to set Stop loss.
The built in ATR indicator plots the ATR values as a line. However, many traders do not want the ATR to be plotted on their charts, but are only interested in the ATR value as such.
This script does that - it just prints the latest ATR with your set Multiplier value on the chart. I have used the built-in ATR indicator and made necessary additions to the code.
I hope this script proves useful to traders.
Queries / feedback welcome.
All the best.
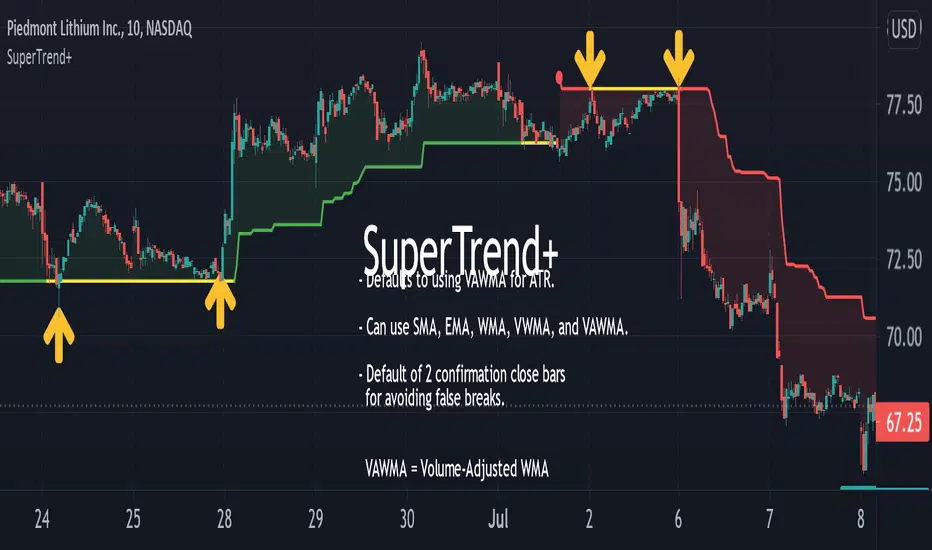
SuperTrend+Based upon popular SuperTrend (AKA: ATR Trailing Stop) indicator with the following differences and improvements:
Defaults to using Volume-Adjusted WMA ( VAWMA ) for ATR. (Can still be configured to behave exactly like classic SuperTrend.)
Can use SMA, EMA, WMA, VWMA, and VAWMA instead of just SMA.
Confirmation close bars for avoiding false breaks.
Details:
If the confirmation closing bars value is greater than zero (default of two bars), the trend will only reverse if the price closes outside the boundary for that number of bars (does not need to be consecutive) or if the opposite side of the bar exceeds the boundary.
The confirmation bar count will reset if the trend has resumed (opposite boundary is broken).
Confirmation examples:
In a down-trend, but the previous two bars close above the boundary.
In a down-trend, but the low of the previous bar exceeds the boundary.
In a down-trend, but the high of the previous bar exceeds the boundary when confirmation bars are set to zero.
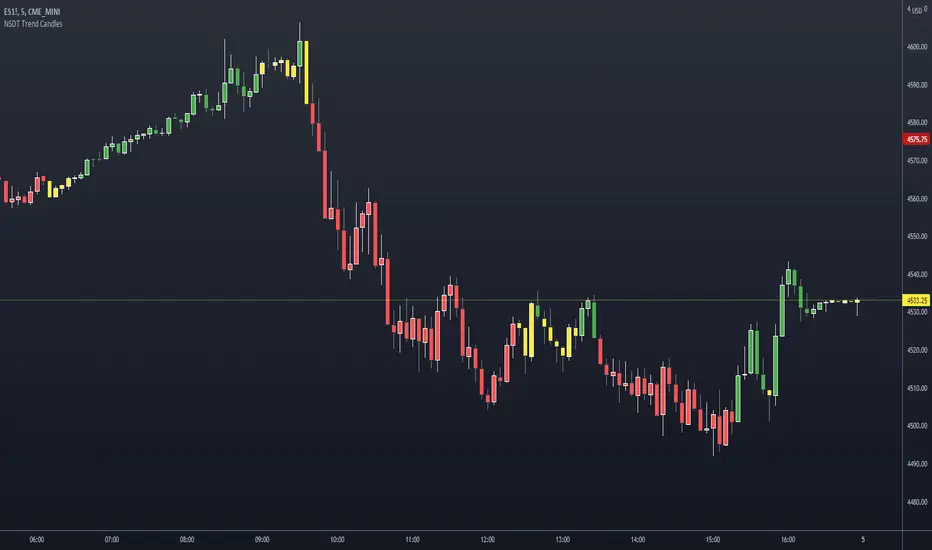
NSDT Trend CandlesThis script changes the color of the candles based on uptrend (green), downtrend (red), neutral/chop (yellow). It uses an ATR and Pivots to determine the direction, or lack of. Since all markets move differently and market volatility changes, you will need to adjust the settings to find a potential match for the day. It's pretty simple to use. Just enter in the direction of the trend and exit (or reverse) when the candle color changes.
Dynamic SMAThis script uses dynamic length to create a different sma type.
The length of the "Dynamic SMA" - "dSMA" can be:
'RSI', 'Stoch', 'ATR', 'MFI' or '%R'
For example 'RSI' -> the length of the sSMA will be the RSI itself
The biggest challenge was:
'Pine cannot determine the referencing length of a series. Try using max_bars_back' error
The writer of 'referencing length of a series' issue gave following solution:
bar_index == 0 ? 4999 : len
or in case of values which don't go above 100:
bar_index == 0 ? 100 : len
This assigns the necessary buffer to the function.
I'm most grateful for the given solution!
These dSMA's can give Support/Resistance levels, also crossovers of different dSMA's can give extra information
Examples:
RSI
ATR (close / atr(len)
Stoch
MFI
%R
"show regular SMA" will show the "SMA" with the same length (with default lighter color)

ATR Stop Loss FinderThis Indicator uses Average True Range (ATR) to determine a safe place to put stop losses to avoid being stop hunted or stopped out of a trade due to a tight stop loss. Default multiplier setting is 1.5. For a more conservative stop loss use 2 and for a tighter stop loss use 1. ATR and stop loss prices are displayed in table at bottom of screen. Use high(red) for shorts and low(teal) for longs.

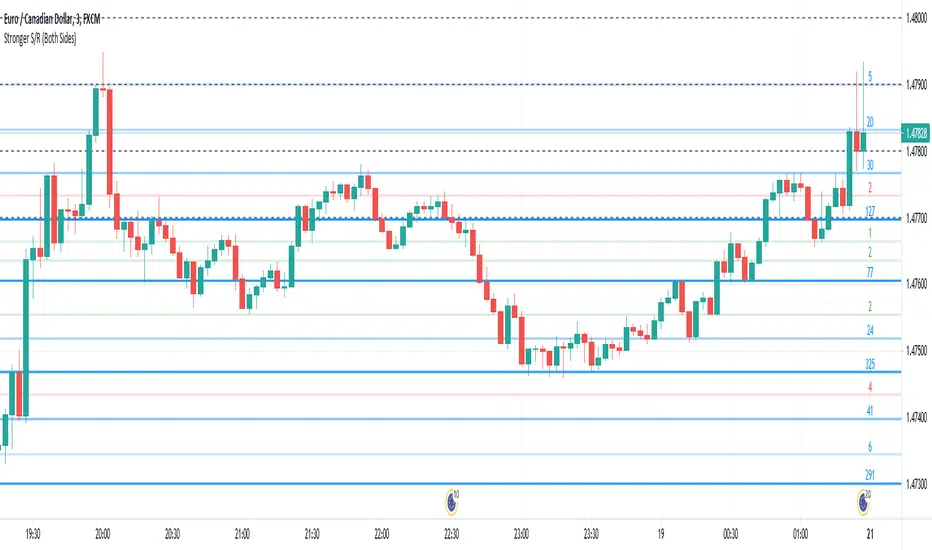
Stronger Classical Support/Resistance + Round LevelsI wrote some Support/Resistance scripts before this. In this new script, I implemented the logic of the code from the scratch, so it's very different from my previous S/R indicators and I think it's more advanced, accurate and efficient.
As the result it could do the followings for now:
- Draw more strong classical resistance/support levels by checking previous direction changes of the chart as far as Pine technically allows
- Colorize the levels based on the counted points of retracement/pullback (The darker the color is, the stronger the level is.)
- Show the number of reactions to each level
- Change the color of each level based on its main role as support, resistance or both
- Draw close round levels to current price for Forex pairs
I suggest all users of my previous S/R indicators to try this one.
Feel free to send me any issue or opinion!
ADR% / ATR / LoD dist. TableDisplays the following values in a table in the upper right corner of the chart:
ADR%: Average daily range (in percent).
ATR: Average true range (hidden by default).
LoD dist.: Distance of current price to low of the day as a percentage of ATR.
All values are calculated based on daily bars, no matter what time frame you are currently viewing. Doesn't work for time frames >1D, which is why the table is not shown on weekly/monthly charts.
Credit to MikeC / TheScrutiniser and GlinckEastwoot for ADR% formula

Supertrend BandsSupertrend Bands
What is the Supertrend indicator?
"The Supertrend indicator is a trend following overlay on your trading chart, much like a moving average, that shows you the current trend direction.
The indicator works well in a trending market but can give false signals when a market is trading in a range.
It uses the ATR (average true range) as part of its calculation which takes into account the volatility of the market. The ATR is adjusted using the multiplier setting which determines how sensitive the indicator is."
"For the basic Supertrend settings, you can adjust period and factor:
- The period setting is the lookback for the ATR calculation
- Factor is the what the ATR is multiplied by to offset the bands from price"
How to use this indicator
This indicator is inspired by a strategy I found. It includes four Supertrend indicators, each with different settings that displays trend strength and support/resistance zones. The default settings are optimal for cryptocurrency but do work quite well for traditional also. I highly recommend you try experimenting with different settings, increasing them to suit the instrument.
The bands are set from low to high, Band 1 being the fastest and Band 4 being the slowest. Band 4 is the one that sets the overall trend so when price is above Band 4, the trend is bullish and vice versa. Trend is strongest when price is above/below Band 1 and gets weaker as it filters through each band. Band 4 provides the strongest support/resistance and if that breaks the trend flips.
In the menu, you will see an option called "Remove Anti Trend?". It is enabled by default and it removes any bearish/resistance bands when the trend is up and any bullish/support bands when the trend is down. When turned off, it will show all Supertrend Bands as they are by default.
Bar Colors
Bar colors are optional and they reflect the current trend strength based on the Supertrend bands.
Alternate ways of using this indicator
You could leave everything as default or you can display individual bands. For instance, because I use many overlay indicators, most of the time I turn off all the bands and only show bar colors:
You can also turn off Bands 1 and 2 and only show the two slowest lengths:
This removes the noise of the two faster Supertrends.
Or just show the two fastest bands:
Any suggestions to improve this indicator are most welcome :)

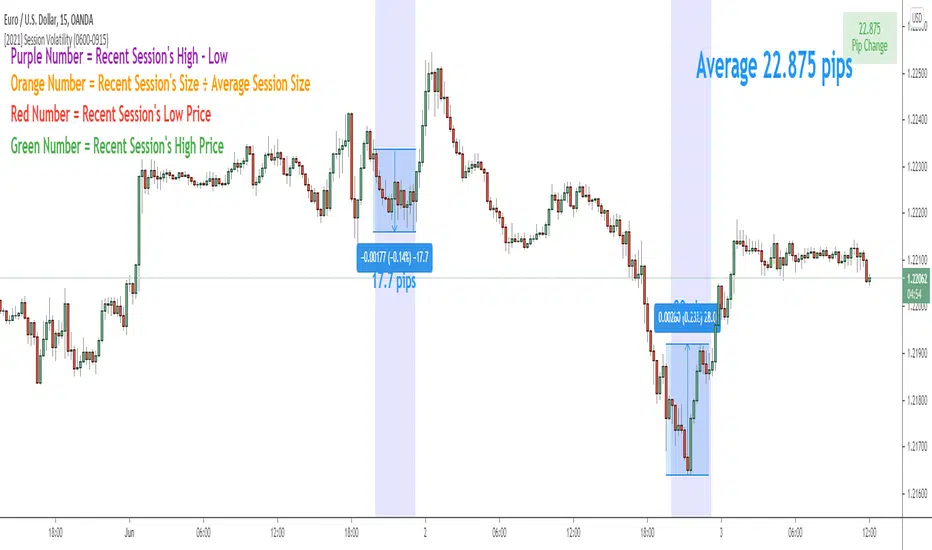
Session Volatility CalculatorHey traders!
This script calculates the average volatility of trading sessions.
You specify a start date, an end date, and a session time (eg. market open, Asian session etc)
The script then scans through all the price action on your chart and calculates the average price movement during that specified period.
What Is It For?
I created this script for my own purposes when developing certain strategies and testing certain ideas.
The purpose of this script is to give you an idea of how much price tends to move during certain times of day for certain markets.
You could think of it as a "session's average true range".
In crypto and forex this might be how much price tends to move on certain pairs during the Australian/Asian session, or the European session, or the overnight U.S. session etc.
In stocks this might be how much a symbol tends to move during the first hour of the day or the last hour of the day.
The point of calculating this information is for better understanding how markets move during certain times of day.
It's not a perfect science obviously since some days can be wilder than others depending on what fundamental events are developing, but it's useful information to have for times when there are no expected volatility-inducing events.
This info can help with optimizing targets and stop loss placement for certain day-trading strategies, and just generally getting an idea of what kinds of moves you might reasonably expect out of overnight positions or certain times of day etc - or at least that's what I use it for.
Settings
Hover your mouse over the "i" symbol to get more information on the script's settings, but here's a brief description:
Start Date: The date to begin calculating from (set to 1000 by default so it scans the entire chart).
End Date: The date to stop calculating (set to 2099 by default so it scans the entire chart)
Time Session: This is the time session during the day that you want to analyze.
Color Background: If turned on, this setting changes the background color to highlight the session.
Indicator Values
The indicator outputs a handful of values onto your chart. This is what the colors correspond to:
Top-Right Box: The average price range during the given time of day over historical price action.
Green Number: The recent session's highest price.
Red Number: The recent session's lowest price.
Purple Number: The recent session's price range (high - low).
Orange Number: The recent session's range ÷ the average (outputs a relative % of the average).
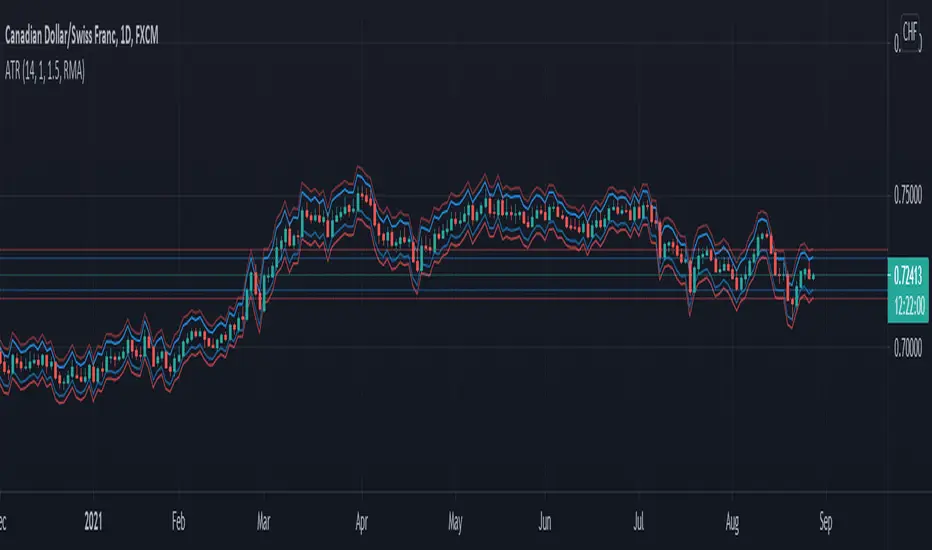
MTF atr_channelThis is the Multi TimeFrame Version of previous atr channel, which uses the ATR percent(atr%) instead of the 2% fixed deviation for calclation of bollinger bands.

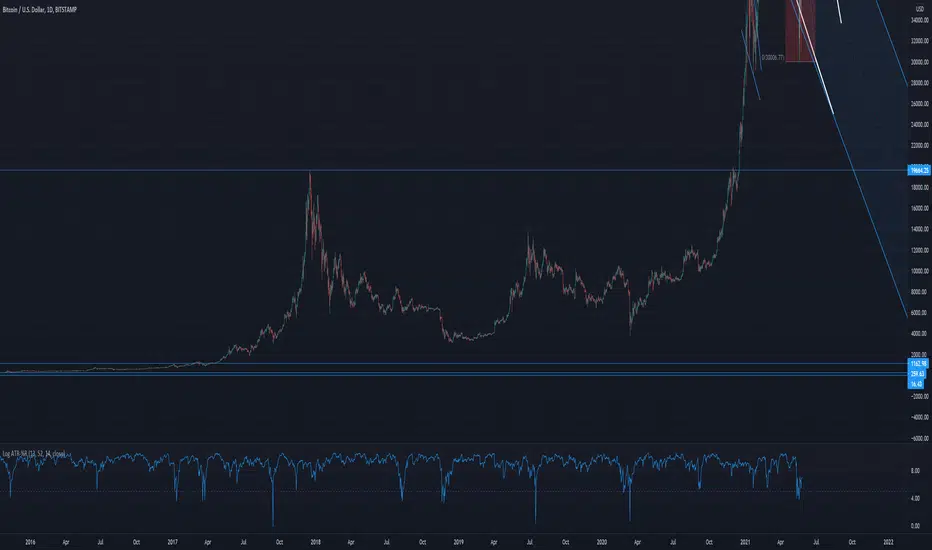
Log ATR-%RThis indicator uses a combines the "Williams %R" and "ATR_Normalized" indicators to find potential price bottoms, as suggested by simultaneous extreme values on both of the aforementioned indicators. This is represented by near zero values one this indicator. A log transform is used to make the dips easier to spot.
ATR-%RThis indicator uses a combines the "Williams %R" and "ATR_Normalized" indicators to find potential price tops and bottoms, as suggested by simultaneous extreme values on both of the aforementioned indicators.

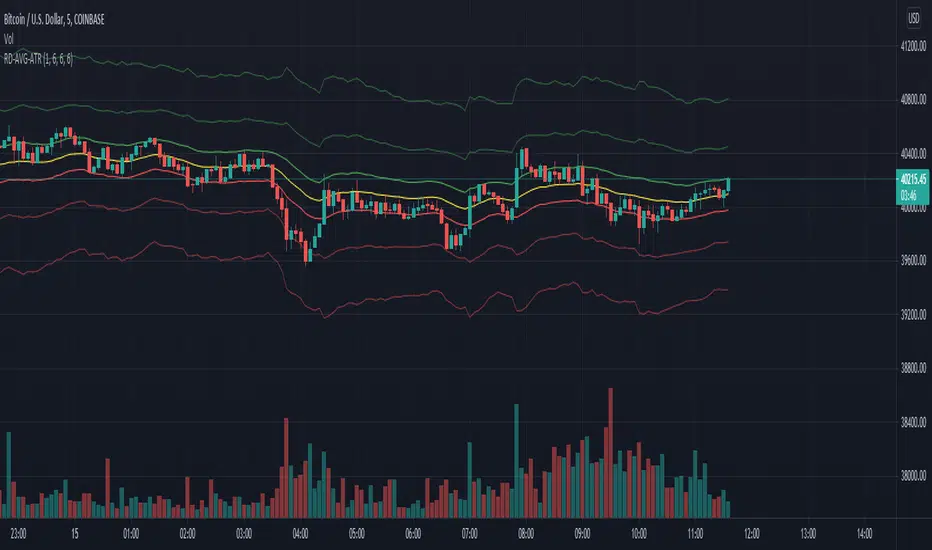
RexDog Average with ATRBam-- look what Rex did. A RexDog Average with ATR bands-- he's going insane. Simple but powerful.
This indicator includes the RexDog average but provides you with the ability to plot (and customize) both above and below ATR calculated bands.
With this indicator you can display all 3 or any combination of the bands: the RexDog Avg, Adding ATR Upper or the Subtracting ATR Below.
To remove a plot or customize color and line size go to the style options.
Before we get detailed with this version you can customize the default average factor of the RexDog Avg (default is 6). More tips on this below.
How This Works
Just as with the RexDog Average we take the 6 ATR data points (200, 100, 50, 24, 9, 5). We then create an average by dividing by 6. But wait there's more...
With this indicator you can customize independently the above and below bands via a float value for precision. 6 is the default (you can customize by increments at 0.25 or input value you like 1-20).
Now this works opposite how you might think but you'll get it once you start changing the numbers. For instance, editing the above band lowering the ATR factor will raise the band.
RexDog Avg Factor
With this release you are able to change the default average factor (6) to anything you want. You'll find though going too high or low from the default won't get the best results. The default increment change is 0.1 but you can enter any float value you like between 1-20.
The Original RexDog Average Overview
Yes, simple—the RexDog Average is a bias moving average indicator. The purpose is to provide the overall momentum bias you should have when trading an instrument. It works across all markets and all timeframes.
Usage:
Price above the RexDog AVG = long momentum bias
Price below the RexDog AVG = short momentum bias
With the ATR addition most likely your usage will be similar to Bollinger Bands. While not the same as in deviations much of the same principles might apply, especially with customization.
*Note: we have banned the word “trend” in the RexDog Trading Method.
Additional Usage Advice:
If price rips through the average your momentum bias should probably change. 80% of the time when price moves through the RexDog Average it will come back and test the area around average within 1-2 bars. 20% of the time it does not. The momentum is so strong in that direction so look for a 50-70% tests of the bar that impulse through the RexDog Average.
If you are using the RexDog Trading Method by default if the price is above the average and you are short you are in a fade trade. The momentum trade would be long. Of course reverse if price is below.
On multiple time frames. Of course, one timeframe can be long bias and a lower timeframe can be short bias. Which one do you use? Both—if your in a short trade using lower timeframe and with the bias of the average your in a momentum trade—but on the higher timeframe your aware you are essential fading the overall momentum.
Background:
Rex and I searched high and low for one simple thing. A moving average (or combination of some) that we could use to form our momentum bias that worked for all timeframes and all markets we trade.
We tried and tested them all. Even went down the path of ribbons and various other types of hybrid EMA /MA derivatives. Nothing had a high enough accuracy or mathematically was reliable that we could say with a high probability that it was on the right side of the momentum.
We almost stopped and landed on using the true and tested 200 MA—but we found through extensive tests that using the 200MA or EMA you’re often late to the party. Look you don’t need to be the first one in the trade but having a heads up sure helps.
To quote one of the best financial movies of the modern era—Margin Call:
“There are three ways to make a living in this business: be first, be smarter, or cheat… it sure is a hell of a lot easier to be first”. The RexDog Average used properly enables you to be first or damn near close.
Under the Hood:
This is so simple most reading this will discount it. You might even scoff and berate Rex for wasting your time. But you would be wrong. The RexDog Average has been tested across all markets—FOREX, Crypto, Equities, Futures (even tick charts), and even the Penguin population in Antarctica.
The RexDog Average is an average of 6 simple moving averages: 200, 100, 50, 24, 9, 5.
Yes, that’s it.
FibFans on Previous HTF HL [FaizanNawaz] by DGTFibonacci Fans application on top of Previous Higher TimeFrame High and Low. Idea owner is @faizannawaz1, special thanks to him for both the idea and tesing the application
WARNING : Study includes plottings in the future, and due to temporal gaps in non 7/24 markets such as weekends, holidays etc plotting of the fans will move to the open session (the effect will be observed on Friday and Monday). With crypto no any side affect will be observed.
More about Fibonacci Fans, how to apply fibonacci fans and automated fibonacci speed and resistance fans study
Adiitonally the study includes some addons, such as
Central Pivot Range and Traditional Pivot Points
Volume Weighted Colored Bars
Price Range Meter - Horizontal HTF Candle
Disclaimer :
Trading success is all about following your trading strategy and the indicators should fit within your trading strategy, and not to be traded upon solely
The script is for informational and educational purposes only. Use of the script does not constitute professional and/or financial advice. You alone have the sole responsibility of evaluating the script output and risks associated with the use of the script. In exchange for using the script, you agree not to hold dgtrd TradingView user liable for any possible claim for damages arising from any decision you make based on use of the script

Position Sizing w/ ADR&ATR TrackingScript to use for position sizing based on portfolio size, max position, and max loss inputs. The option to use custom entry and stop are available, but default to last price for entry, and Low of Day (LoD) for stop. The ATR % is a measure of the low of day to current price as a percentage move.
Credit to LonesomeTheBlue for the base code on position sizing and TheScrutiniser/GlinckEastwoot for ADR formula
-Nelgoth, best of luck

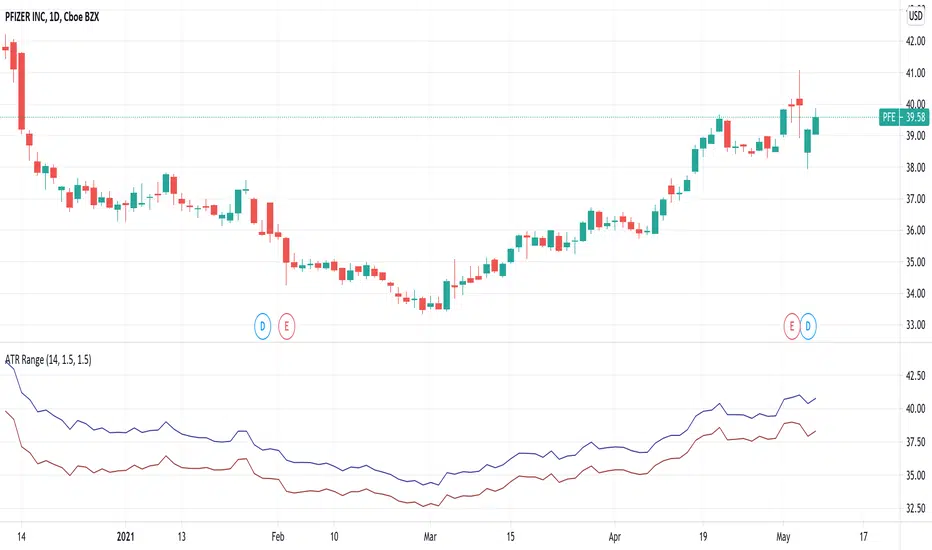
ATR RangeUseful in case you use Average True Range to determine Shows Stop Loss and Take Profit price levels.
For example, if you want to put Stop Loss with a distance of 1.5xATR and Take Profit 2xATR for a long trade, put 1.5 as Lower Factor and 2 as Upper Factor. Lower and Upper prices will show price levels for SL and TP respectively.