ATR Drift %This script plots an histogram calculated this way:
Get the previous ATR sample, calculated in the specified timeframe
Get the actual open price of the bar in the specified timeframe minus the actual price in the current timeframe
and plots the percent change between the the 2 values
For example, if you select DAY as timeframe for the ATR:
Plots the percent change between:
- ATR(daily) from yesterday
and
- open from today - actual price
Due to Tradingview limitations, only shows the plot if the actual timeframe of the graphic is equal or lower that the ATR selected timeframe
The background changes shows a new ATR sample taking place
I'm testing this for scalping in 5M timeframe with the ATR in 4H
All my published scripts at: es.tradingview.com
ATR

ATR Daily Drift %This script is an especial request from a user
Plots the percent change between:
- ATR(daily) from yesterday
and
- open from today - actual price
Due to Tradingview limitations, only shows the plot if the actual timeframe of the graphic is daily or lower.
All my published scripts at: es.tradingview.com

intraday_bondsStatistics for assisting with intraday bond trading, using five minute periods and one hour ranges. There are two tables, a volatility table and a correlation table. The correlation table shows the correlation of five minute returns (absolute) between the four different bond contracts that trade on the CME. The volatility table shows for each contract:
- The current realized volatility, based on the previous one hour of realized volatility. This figure is annualized for easy comparison with options contracts.
- The current realized volatility's z-score, based on all available data.
- The tick range of an "N" standard deviation move over one hour. Choose "N" using the stdevs input.
- The previous hour's true range (high - low).
The ranges are expressed in ticks.

GBTT Range Wave IndicatorOverview:
This script is a type of mean reversion indicator, it uses a short period EMA, the EMA5 to be exact, as its basis for a mean. From here, we run a modified version of ATR over a longer period of time to find an average range value for price movement. Finally, we calculate the cloud/band/wave by multiplying this range value by our deviation values to produce areas where the price could be considered too far from the mean (similar to an oversold or overbought scenario).
Additionally, we wrote this script with a goal to reduce or eliminate repainting. In the code, we have utilized OPEN values (instead of CLOSE) and previous candle values (not the current candle) to build all the data for the algorithm here to avoid the waves constantly moving and changing their values on real time candles. That said, this is NOT a guarantee that it will never repaint.
What you see:
Visually, the waves are always on the chart. Optionally, we provide a custom standard deviation channel based off the EMA5 (represented with a blue shading) and/or a simple ema5/21 crossover cloud. These can be used for additional confluence if desired, but are not necessary for the core function of the indicator which would be the upper and lower wave.
Intended use:
To provide educational content about the short term movement of an asset. Designed to be run on any time frame.
Disclaimer:
NOT intended to be a sole source of Technical Analysis or anything more than an educational tool!

Saty ATR LevelsThis indicator uses the previous period close and +/- 1 ATR to display significant day, multiday, swing, and position trading levels including:
- Trigger clouds for possibly going long/short @ 23.6 fib
- Mid-range level at 61.8 fib
- Full range level at +/- 1 ATR (from previous close)
- Extension level at 161.8 fib
Additionally, a convenient info table is provided that shows trend, range utilization, and numerical long/short values.
This indicator is most beneficial when you combine it with price, volume, and trend analysis. For educational content please check out the indicator website at atrlevels.com.
I am constantly improving this indicator, please use this one if you want to continue to get new features, bug fixes, and support.

Volatile Atr 1859It shows the volatility (mobility) of a cryptocurrency. Comparisons can be made between cryptocurrencies in terms of mobility. Atr period can be entered. Atr volatility can be entered. Thus, if the volatility in a bar is higher than the entered volatility, the indicator b sign goes down. The more b signs there are, the more volatile it is. Average Atr period can be entered.
Turkish: Bir kripto paranın volatilitesini (hareketliliğini) gösterir. Kripto paralar arasında hareketlilik yönünden karşılaştırma yapılabilir. Atr periodu girilebilir. Atr volatilitesi girilebilir. Böylece, bir bardaki volatilite, girilen volatiliteden yüksek ise gösterge b işareti düşer. Ne kadar çok b işareti varsa, o kadar volatildir. Ortalama Atr periodu girilebilir.

ATR Report & Tool█ OVERVIEW
This indicator reports the historical probabilities of the price trading past its Average True Range (ATR).
█ CONCEPTS
It is common knowledge that the market is not likely to trade past 1x ATR. Is this true? How much unlikely exactly? The indicator reports the data in a table and tells you precisely how often the price made it past x times ATR.
You have identified two plausible entries at different price structures or two targets at significant projections; which one should you choose? While is it possible to reach them, is this indeed probable? The indicator complements your analysis for making sounds trading decisions.
█ FEATURES
Price Selection Tool
The indicator has a price selection tool embedded. You can select a price on the chart and it will show the distance relative to the ATR so you can easily refer to the historical probability table.
Multi-Timeframe
By default, the indicator uses the daily timeframe for analyzing how much price moves compared to its average volatility during a day. To the same extent, you can set it to any other timeframe.
Configurable ATR
• Pick your preferred smoothing between the Simple Moving Average (SMA) or the Relative Moving Average (RMA).
• Set the length for getting the average price movement. For example, you can set it to 20 for the daily ATR (20 trading days in a month), 12 for the weekly ATR (3 months), or 6 for the monthly ATR.
• Select the reference between “previous” or “current” ATR value (default set on previous).
Data Window
The indicator provides additional volatility-related values and reporting data.
Others
Automatically hides the indicator when the chart’s timeframe is higher than the indicator’s one.
█ NOTES
Calculation
The volatility is calculated from the selected period's low to high. It may use the previous close when the market gaps up/down.

SuperJump Turn Back Bollinger BandThis is a simple indicator using bolinger band return.
After the candle's bolinger band broke out,
Turn back inside BB is the entry point.
Usually there are more than two triangles, so you can wait after ordering a better price.
As you already know about it, it is very dangerous for the bolinger band to enter in the reverse direction when a strong trend is created.
That's why I made the Red Line. It is calculated by ATR and will suggest you an appropriate StopLoss value.

Super Scalper - 5 Min 15 MinThis strategy is based on RSI and ATR Bands which works better in 5 and 15 Mins time frame.
Perform enough back testing with 1:2R before using in real time.
Entry only on trade on screen symbols, use additional buy/sell alerts to book profit or to trail SL.
I have also added Golden Cross Over of 65 and 21 EMA to have confirmation on trend.

SuperTrend OptimizerHello!
This indicator attempts to optimize Supertrend parameters. To achieve this, 102 parameter combinations are tested concurrently - the top three performers are listed in descending order.
Parameters,
Factor: Changes to this parameter shifts the tested factor range. For instance, increasing the factor measure from 3.00 to 3.01 (+0.01) will remove 3.00 from the tested range - this setting controls the lower threshold of the range. The upper threshold, in all instances, is the lower Factor threshold + 3.3 (i.e. 3.0(lower) - 6.3(upper), 4.0(lower) - 7.3(upper), 2.5(lower) - 5.8(upper))
ATR period: Changes to this parameter shifts the tested ATR period range. For instance, increasing the ATR measure from 10 to 11 (+1) will remove 10 from the tested range - this setting controls the lower threshold of the range. The upper threshold, in all instances, is the lower threshold + 2 (i.e. 10(lower) - 12(upper), 11(lower) - 13(upper), 9(lower), - 11(upper))
The Factor parameter is modifiable to any positive decimal number; the ATR parameter is modifiable to any positive integer. Changing either parameter shifts the tested parameter combination range. Both parameters can be changed in the settings, to which you control the lower threshold of the range. If, for instance, you were to change the Factor measurement from 3.0 to 4.1 (+1.1) the 4.0 Factor measurement, and all Factor measures less than 4.0, will be excluded from the performance test.
Consequently, a Supertrend test will be performed with a Factor of 4.1 and an ATR period of 10 (default). This test repeats at 0.1 Factor intervals and 1.0 ATR intervals.
Therefore, assume you modify the Factor lower threshold to 3.1 and the ATR lower threshold to 10. The indicator will test three Supertrend systems with a Factor of 3.1 and an ATR period of 10.. then 11.. 12, then three systems with a Factor of 3.2 and an ATR period of 10.. then 11.. 12... until (lower Factor threshold + 3.3) and (lower ATR threshold + 2) are tested... which in this example is... a Factor of 6.4 and an ATR period of 12.
The tested Factor range and ATR range are displayed in a bottom right table alongside the top performing parameter combinations.
Of course, you can change the the lower thresholds, which means you can test numerous Supertrend parameter combinations! However, no greater than 102 parameter combinations will be tested simultaneously; the best performing Supertrend parameters are plotted on the chart automatically.
I will be working on this indicator more tomorrow! Let me know if you have questions or anything you would like included!
(I of course added something fun in the script. Be sure to try it with bar replay!)

SSL + Wavetrend (7 indicators) by TradeSmartHello everyone! This script is implementing a strategy that uses 7 indicators: SSL, Wavetrend, SSL Hybrid, Keltner Channel, EMA, Candle Height and ATR. This is the 2nd best strategy that we have tested so far (based on the 100 backtests).
STRATEGY ENTRY RULES
Long entry: go long if SSL Hybrid is blue (between last candle and entry candle) and SSL Channel crosses up (green SSL line is on the top) and Wave Trend prints green dot (candle color turns yellow) and entry Candle Height is not higher than 0.6 and entry candle is inside the Keltner Channel and price target does not hit the 200 EMA.
Short entry: go short if SSL Hybrid is pink (between last candle and entry candle) and SSL Channel crosses down (red SSL line is on the top) and Wave Trend prints red dot (candle color turns blue) and entry Candle Height is not higher than 0.6 and entry candle is inside the Keltner Channel and price target does not hit the 200 EMA.
EXIT STRATEGY
The strategy will exit based on a set ATR value. Take profit and stop loss levels can be changed with risk/reward settings.
CHANGEABLE SETTINGS
Wave Trend: Channel Length, Average Length, Wave Trend Limit High, Wave Trend Limit Low
SSL: Period
SSL Hybrid: SSL1 / Baseline Type, SSL1 / Baseline Length, Base Channel Multiplier
Target Price Limit: can set 6 different limiters for long and short entries
Candle Height Limit: Limit based on, Candle Limit High, Candle Limit Low
Keltner Channel: Limit range long, Limit range short, Length, Multiplier, Source, Use Exponential MA, Bands Style, ATR Length
Exit strategy: ATR Length, ATR Smoothing, Stop Loss Multiplier (risk), Exit Price Multiplier (reward)
Setups: Capital Percentage, Risk Percentage, Allow Long Entries, Allow Short Entries
Date Range: Limit Between Dates, Start Date, End Date
Trading Time: Valid Trading Days
FIRST RELEASE SETTINGS FOR ALGOUSDT 30 M (3/19/2022)
Wave Trend: Channel Length = 11, Average Length = 19, Wave Trend Limit High = 27, Wave Trend Limit Low = -48
SSL: Period = 10
SSL Hybrid: SSL1 / Baseline Type = EMA, SSL1 / Baseline Length = 36, Base Channel Multiplier = 0.21
Target Price Limit: can set 6 different limiters for long and short entries: all false
Candle Height Limit: Limit based on: Candle Body (open/close), Candle Limit High = disabled, Candle Limit Low = enabled, 0.32
Keltner Channel: Limit range long = enabled, Full range, Limit range short = enabled, Full range, Length = 3, Multiplier = 1, Source = close, Use Exponential MA = enabled, Bands Style = Average True Range, ATR Length = 11
Exit strategy: ATR Length = 14, ATR Smoothing = EMA, Stop Loss Multiplier (risk) = 1.9, Exit Price Multiplier (reward) = 2
Setups: Capital Percentage = disabled, Risk Percentage = enabled, 1, Allow Long Entries = enabled, Allow Short Entries = enabled
Date Range: Limit Between Dates = disabled, Start Date, End Date
Trading Time: Valid Trading Days = 1234567
Hope you like this strategy, feel free to check all of our scripts. Thank you for your support!

Multi-Timeframe ATR Levels█ OVERVIEW
This indicator plots the upside and downside ATR levels popularized by Trader Dante.
█ CONCEPTS
Beyond a level's boundary, a market is trading over its average volatility. The indicator adds confirmation to "reversal" setups located at likely mean reversion. Oppositely, it highlights trades with an increased risk where the price is over-extended and when the market is possibly exhausted.
Inside the levels’ boundaries, a market is trading within its average range. The indicator adds confluence to your target selection. Indeed, a target set at or nearby a level is at reasonable reach for the selected period. In addition, it can improve your stop placement. Tucking your stop-loss outside the boundary of a level adds an extra assurance that your stop is beyond reach.
█ FEATURES
Multi-Timeframe
By default, the indicator sets the timeframe to the daily for tracking how much price moves compared to its average volatility during a day. To the same extent, you can set it to any other timeframe. For example, you can use the weekly or the monthly timeframe for adjusting your trading during the week or when approaching the end of the month.
Configurable ATR
• Pick your preferred smoothing between the Simple Moving Average (SMA) or the Relative Moving Average (RMA). The SMA is used in the original MT4 indicator, and the RMA is the default in TradingView.
• Set the length for getting the average price movement. For example, you can set it to 20 for the daily ATR (20 trading days in a month), 12 for the weekly ATR (3 months), or 6 for the monthly ATR. Also, you may set a shorter length when you want to emphasize the recent price volatility.
• Apply a custom multiplier on the ATR when you want to focus on a particular price movement.
• Select the reference between “previous” or “current” ATR value (default set on previous).
Customizable Labels
• Personalize what info to show in the labels located on the right side of the levels. You can compose the data for showing the price, the ATR, both the price and the ATR or none.
• On hovering a label, a smart tooltip displays the complementary data. The less info a label displays, the more its tooltip shows.
• Choose how to display the values. In addition to the labels, the indicator can display the last values on the price scale, the status line, and the data window.
Enhanced Coloring
At a glance, see which level the price is approaching with the "Cold & Warm" coloring or quickly glimpse when the price has reached or exceeded the ATR with the "Overflow" coloring.
Others
• Automatically hides levels when the chart’s timeframe is higher than the indicator’s one.
• Alerts setting.
█ NOTES
Calculation
Upper band = low* + ATR
Lower band = high* - ATR
*The previous close is used when a gap up/down occurs.
This is a PREMIUM indicator. I also have a free version of the Daily ATR Levels .

ATR Trading SetupThis simple script base on function of ATR Trailing Stop (aka SuperTrend) to plot Trading Setup on chart with detail as below:
1. Type of Average True Range (ATR)
+ The function calculate ATR may base on 1 of 3 type of Average: RMA, SMA, EMA
2. Trading Setup
2.1 Long setup
+ SuperTrend is upTrend
+ Entry Long at (or below) last value ATR Trailing Stop of Previous Trend (DownTrend)
+ Stop loss at first value ATR Trailing Stop of now Trend (upTrend)
+ Take profit at first value ATR Trailing Stop of Previous Trend (downTrend)
+ Move stop loss follow ATR Trailing Stop (green dot)
2.1 Short setup
+ SuperTrend is downTrend
+ Entry Short at (or above) last value ATR Trailing Stop of Previous Trend (upTrend)
+ Stop loss at first value ATR Trailing Stop of now Trend (downTrend)
+ Take profit at first value ATR Trailing Stop of Previous Trend (upTrend)
+ Move stop loss follow ATR Trailing Stop (red dot)

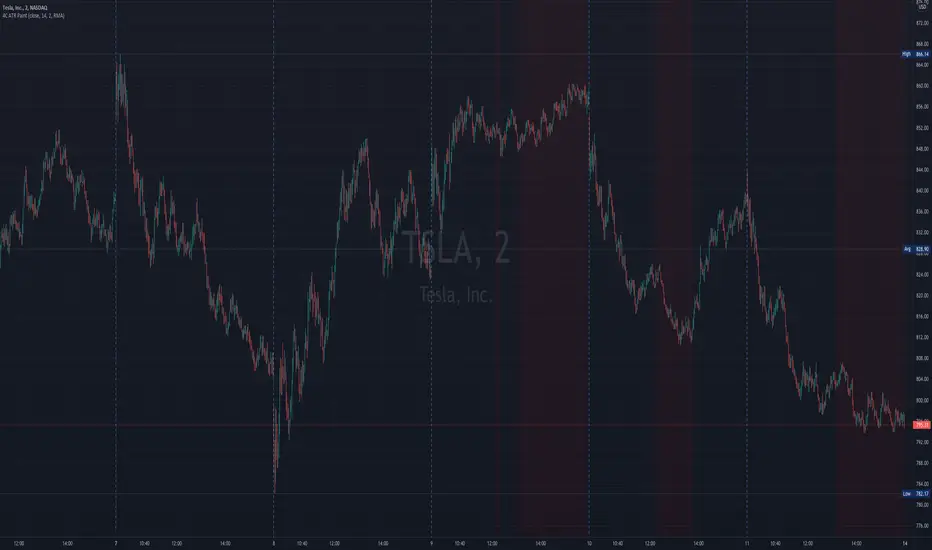
4c ATR ThresholdThe 4C ATR Threshold is a simple indicator that paints the chart background red when the ATR goes below the user defined ATR minimum.
Some trading setups have specific criteria that require a minimum ATR on a certain timeframe for the instrument to be playable.
The painting of the chart background based on the ATR value is useful as a quick visual reference.
The minimum ATR value can be adjusted to any specific level for any timeframe.
If the ATR dips below the user defined minimum, the trader can quickly see that the ATR is below the minimum criteria, and should not trade that instrument (based on their personal trade criteria).
If the background is not painted by the indicator, then the ATR is above the user defined minimum.
Parts of this script used the default/stock Tradingview ATR indicator to build from.
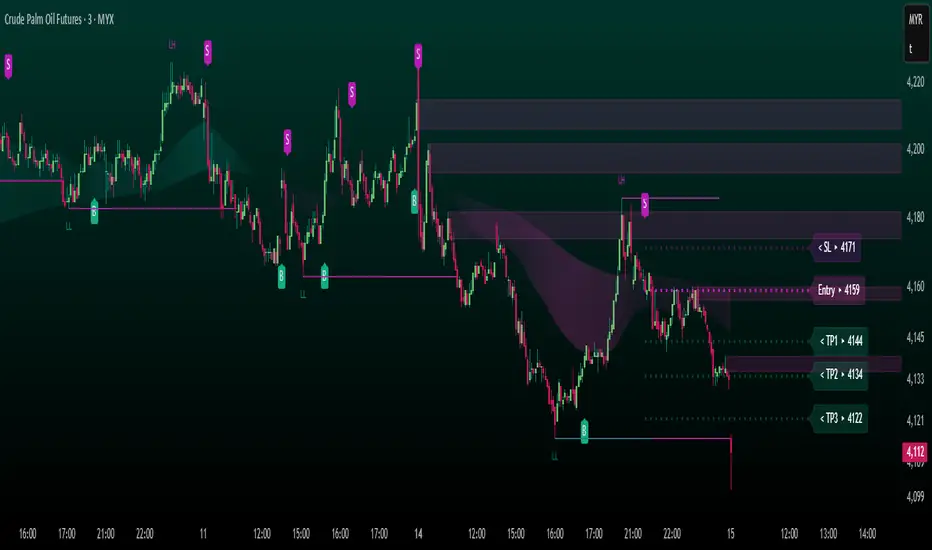
FUTURES ScalpV2 PROTECHFUTURES ScalpV2 PROTECH system
This indicator is built specifically for fast trading i.e. scalping/intraday in the commodity market or futures market. It uses an indicator instrument consisting of ATR TRAILING STOP (ATR), EXPONENTIAL MOVING AVERAGE, PIVOT POINT, and FIBONACCI.
Rebuild of Instrument & Parameter
This indicator is also an upgraded instrument that is sourced from the previous indicator, the COMPLETELY FCPO INDICATOR.
This R&D of course to make trading activities more effective, dynamic and to increase the confidence of traders in current trading activities. The indicator has been upgraded in terms of parameters as well as additional instruments. Among them are;
1. ATR Trailing Stop
2. Exponential Moving Average – fastMA/slowMA Length
3. Label@Entry Price/Stoploss/Takeprofit line
>The best timeframe is 3 minutes
>The take profit and stop loss rates are based on percentages. However
traders can change the percentage rate according to their respective
trading plans.
>existing percentage rates have been set(build-in) specifically for the FCPO
market. So you have to reset for other markets.
>The candle/bars have been colored to make it easier for traders to see price
trends whether in bullish or bearish conditions.
The original instrument has been retained but changed in terms of display & facelift features.
The original indicator (COMPLETELY FCPO INDICATOR) still remains in use and can used together. Hopefully with the combination of these indicators will make traders more successful in trading activities, especially in the futures market.
DISCLAIMER;
ALL NOTES AND INDICATING TOOLS ARE FOR EDUCATIONAL ONLY AND AS A FACILITATOR AND PREPARATION IN TRADING ACTIVITIES. ADMIN IS NOT RESPONSIBLE FOR ANY RISKS IN YOUR TRADING ACTIVITIES. TAKE AT YOUR OWN RISK.
FunTrader/Aieyee @2022
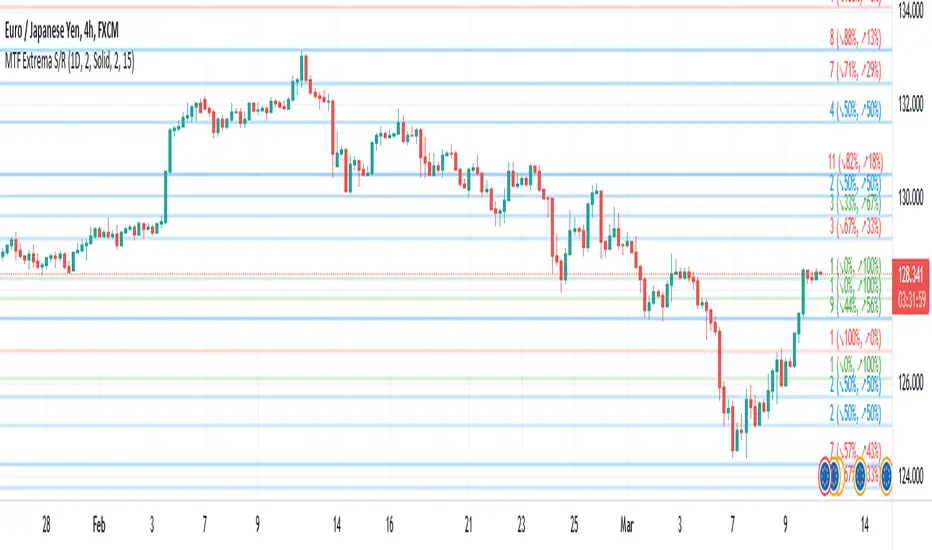
Multi-TimeFrame Extremum Points Support/ResistanceIntroduction
This is my newest Support/Resistance indicator based on the idea of my previous script which had been featured in Editors' Picks .
Everyone seems to have their own idea of how you should measure support and resistance levels. This code finds the exact highest and lowest price points (Extrema) on the chart and then draws the support and resistance levels on them.
In my opinion, the advantage of this method is that the most powerful resistance/support levels which usually cover the supply/demand areas would be formed on these extremum points, as the following facts state.
Facts
1. Support and resistance levels are one of the key concepts used by technical analysts and form the basis of a wide variety of technical analysis tools. Technical analysts use support and resistance levels to identify price points on a chart where the probabilities favor a pause or reversal of a prevailing trend.
2. Supply and demand zones are natural support and resistance levels and a popular analysis technique used in day trading. The zones are the periods of sideways price action that come before explosive price moves. A supply zone forms before a downtrend and a demand zone forms before an uptrend. When the price leaves the supply/demand zone and starts trending, the strong imbalance between buyers and sellers leads to strong and explosive price movements.
3. Based on Dow Theory, trends persist until a clear reversal occurs. A reversal is a change in the price direction of an asset. Reversals typically refer to large price changes, where the trend changes direction.
Challenges
The most challenging part in implementing a S/R indicator which draws all the levels on the chart is the problem of congestion!
But we should notice two other facts:
1. The more times the price tests a support or resistance area, the more significant the level becomes.
2. A previous support level will sometimes become a resistance level when the price attempts to move back up, and conversely, a resistance level will become a support level as the price temporarily falls back.
So, I solved the problem using these two approaches:
Merging nearby levels and showing the role of the levels in colors and numbers
Avoiding many weaker levels by checking higher time frames
Settings and Usage
There are some options in the indicator settings as described below:
Calculations Time Frame: By changing the time frame, user could keep only the stronger S/R levels on the chart.
Level Colors: By default, lowest points (Supports) are green, highest points (Resistances) are red and merged levels are blue. Note that the transparency of the colors would be calculated automatically; The more opaque the color is, the stronger the level is!
Lines Style and Width: The style of the levels could be solid, dashed or dotted and user could also change the lines width in pixels.
Length of the lines: This option is based on the count of bars, but user could simply choose to extend the levels
Merge Nearby Levels: The proximity of the levels would be calculated automatically based on ATR (Average True Range) and the default length of the formula could be changed.
Labels: Each level could have a label consisting the count of merged levels into one, the percentage of merged supports/resistances and the price of the level. Note that if user choose to see the percentage of S/R roles, the color of each label changes automatically based on the main role of corresponding merged level (e.g., a blue level with a red label means that the level more acted as resistance).
I think the users of my previous S/R indicators could check this one
That's it for now! Feel free to send me your thoughts!
Stairs Gain Strategy - MGI will explain step by step.
1- The position order filtering option is used to filter out duplicate positions.
2- The reason I use an ATR multiplier is to balance the ATR value that differs in instruments.
3- ATR lower limit and ATR upper limit values are to reduce unnecessary transactions and commission expenses in the horizontal market.
4- Strategy take profit and stop loss levels are calculated as percentages. The reason why there is no point account is that it can be used in the stock market.
5- Developer friends can get a more efficient result in forex market instruments by converting this to a point account.
Notice :
Variables are different in each instrument. Therefore, this strategy should be optimized for each instrument used.

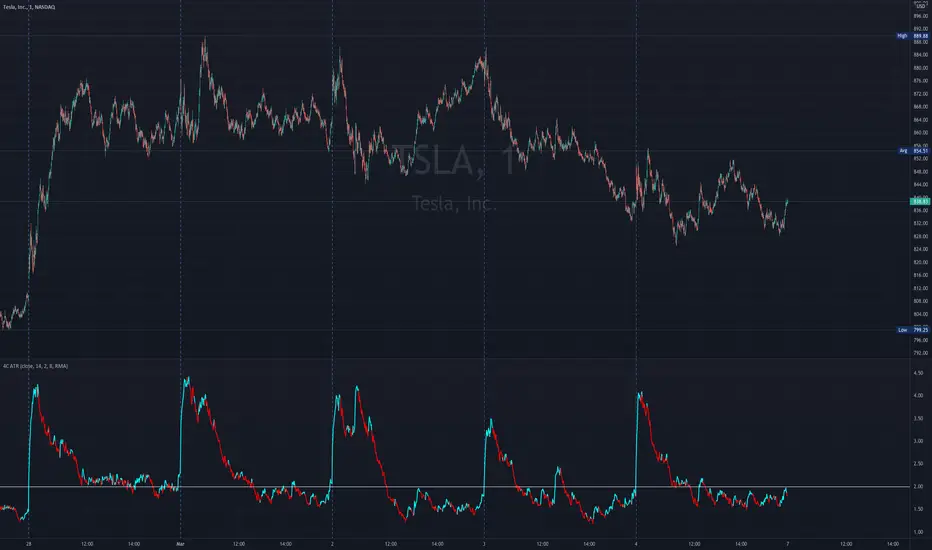
4C ATR w/ Reference LineThe 4C ATR is a simple indicator that plots a horizontal line on the ATR indicator, which can be used as a minimum or maximum reference value.
Some trading setups have specific criteria that require a minimum ATR on a certain timeframe for the instrument to be playable. The horizontal line is useful as a quick visual reference, and can be adjusted to any specific level for any timeframe. If the ATR dips below the horizontal line, the trader can quickly see that the ATR is below the minimum criteria, and should not trade that instrument (based on their personal trade criteria).
This indicator also features a color change of the ATR line based on trend direction. If the ATR is trending up, it is painted blue, and if it starts to trend down, it is painted red. It uses a hidden simple moving average of the ATR, and the slope direction of the moving average paints the ATR line. The moving average length can be adjusted, and is set at a length of 8 for default. The ATR is set at a default value of 14.
Parts of this script used the default/stock Tradingview ATR indicator to build off of.
[BA] ATR Stop LineThis indicator helps you to set your stoploss levels by using ATR. Traders often use atr values in order to calculate their stoploss levels.
This indicator does the calculation for you and draw two tiny lines without messing up the chart so that you can easily see your stoploss levels and get an idea about the volatility and risk amount as well.
One line is below the last candle as a long trade stop loss level and the other one is above the last candle as a short trade stop loss level.
Calculation is simple:
For short trades, 2 times ATR added to last price;
For long trades, 2 times ATR subtracted from last price.
You can change ATR length, ATR multiplier and the line length.
Good luck.

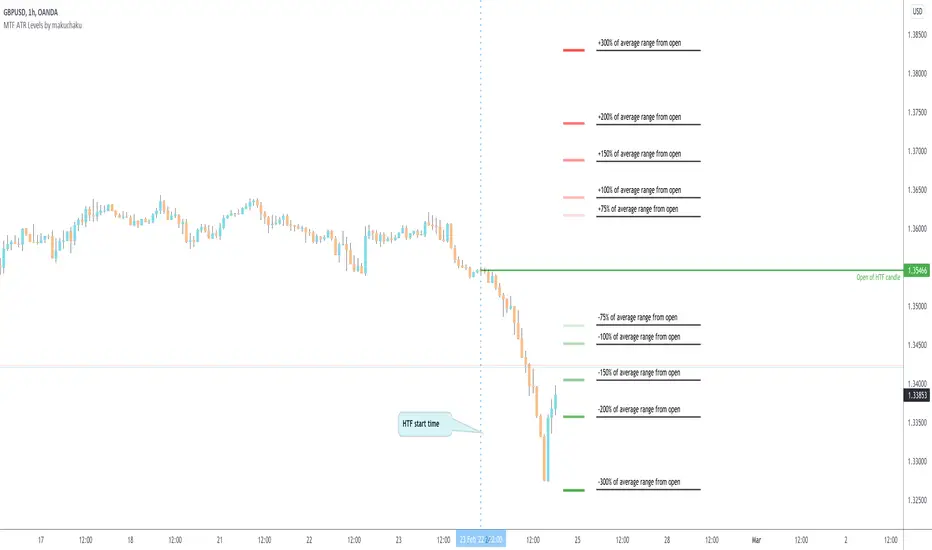
MTF ATR Levels by makuchakuKnowing how big a range one is operating in (from a higher time frame perspective) is very important to understand where the reversals could potentially come from.
This indicator uses the closing price of previous HTF candle and plots its ATR range - and several levels on top of it.
+/- 75%
+/- 100%
+/- 150%
+/- 200%
+/- 300%
adx: Configurable ADX (library) Library "adx"
Calculate ADX (and its constituent parts +DI, -DI, ATR),
using different moving averages and periods.
adx(atrMA, diMA, adxMA, atrLen, diLen, adxLen, h, l, c)
Parameters:
atrMA : Moving Average used for calculating the Average True Range.
Traditionally RMA, but using SMA here and in adxMA gives good results too.
diMA : Moving Average used for calculating the Directional Index.
Traditionally, RMA.
adxMA : Moving Average used for calculating the Average Directional
Index. Traditionally RMA, but using SMA here and in atrMA gives good results
too.
atrLen : Length of the Average True Range.
diLen : Length of the Directional Index.
adxLen : Length (smoothing) of the Average Directional Index.
h : Candle's high.
l : Candle's low.
c : Candle's close.
Returns:

Strategy - Cryptosystem NNFX wayFirst script done!
This is my version of the No-Nonsense Forex (NNFX) Strategy
This strategy shows you the entry and exit signal with a standard 1.5 x ATR for Stop Loss and 1 x ATR for Taking Profit. You can adjust the settings to your needs.
This strategy uses 5 indicators:
1. Average True Range for SL and TP placement, there is a nuance where you can add the 1XATR Rule;
2. SMA used to filter longs and shorts;
3. SSL Channel for 1st Confirmation;
4. DPO for 2nd Confirmation;
5. Waddah Attar Explosion as a volume indicator.
There is no exit indicator because I coded 2 trades (2x0.5). TP1 will be at 1xATR and TP2 will automatically trail behind with 1.5XATR. You can see the red trailing line on the charts.
Other exits can be: When SSL gives opposite signal or when price crosses and closes your baseline.
I used this system for 1D timeframe.
Hopefully this can be usefull for your tradingstyle.
Would be great if you guys leave a like.
Thanks!

Flat Detect By Bollinger BandsThis simple script indicate the potential flat market zones, calculated based on the Bollinger Bands width.
It's showing the Bollinger Bands in red when the market is detected as flat.
You can adjust the Width Threshold with precision on the inputs settings.
Enjoy :)
