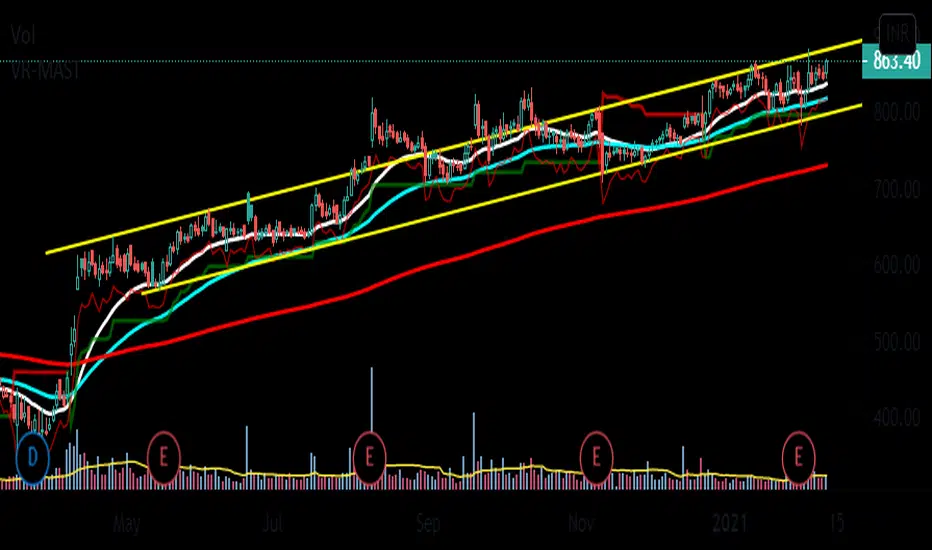
VR-MASTThis is a my script for a super simple trading strategy - ZEST.
Identify Zone of Value, Enter on pullback, place proper Stop Loss and set achievable Targets.
So, to identify Zone of Value, I have EMA in my script.
20EMA generally acts as a dynamic Support/Resistance zone.
For Buy Stop Loss, we have 1ATR below Swing Low.
Then, we have SuperTrend for Trailing Stop Loss.
ATR
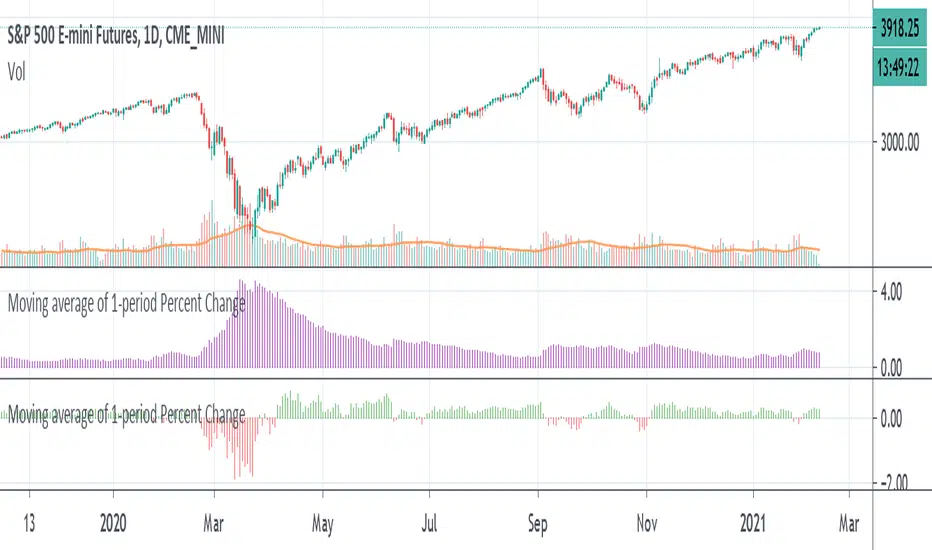
Moving average of 1-period Percent ChangeAnother way of finding the average range of the bars using 1 period percentage change of the price and taking an average of them. It's given in percentages and the absolute value of the average can be shown when the option is turned on, or the average including the up and down bars can be shown. Perhaps an alternative way of looking at volatility or range of the bars. If you prefer a line version over histogram, just simply change the style under the settings of the indicator.
PVA Range High & LowFINALLY LEFT. the RANGE DAILY at the top RDH and the RANGE DAILY at the bottom RDL, is a PVSRA indicator used to calculate the daily ATR (Average True Range), with the help of my friend @ferhro, I was the one that managed to get closer to the original indicator for the metatrader 4.
Let's the features.
This indicator works as a support and natural resistance of the price, as it has a similarity with the pz supertrend, only on the daily chart.
Range daily High is the gray color and Range daily Low is the red color.
To extract the greatest potential from this indicator, I recommend using forex.
The indicator will be open source for suggestions for improvements.

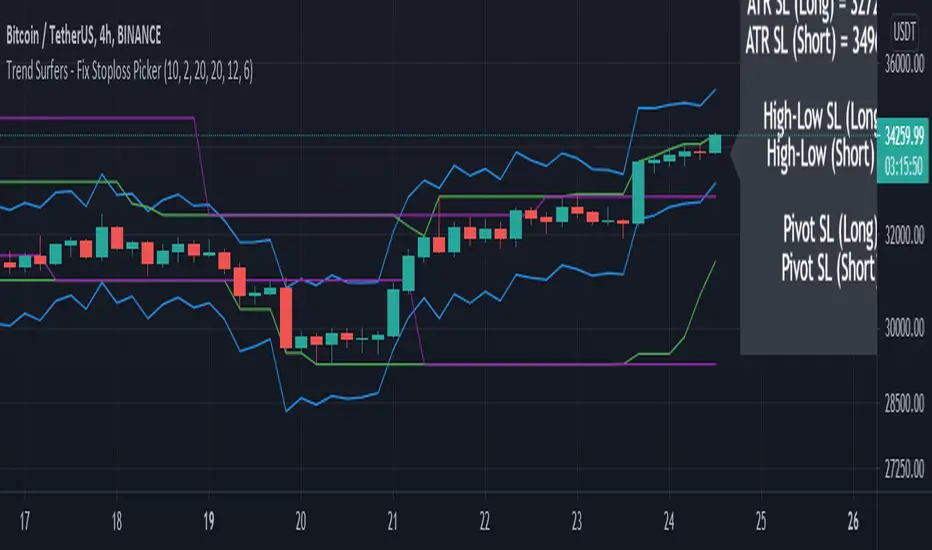
Trend Surfers - Fix Stoploss PickerThis study include 3 types of stop-loss (ATR, High/Low and Pivot point)
This script aimed to help new traders to respect risk management.
Simply select which stop-loss you would like to use in the settings and the suggested stop-loss will be displayed on the chart for Long and Short positions.
Please let me know in the comment if you would like me to add more indicators for the stop-loss in this script.
Hope you like it!
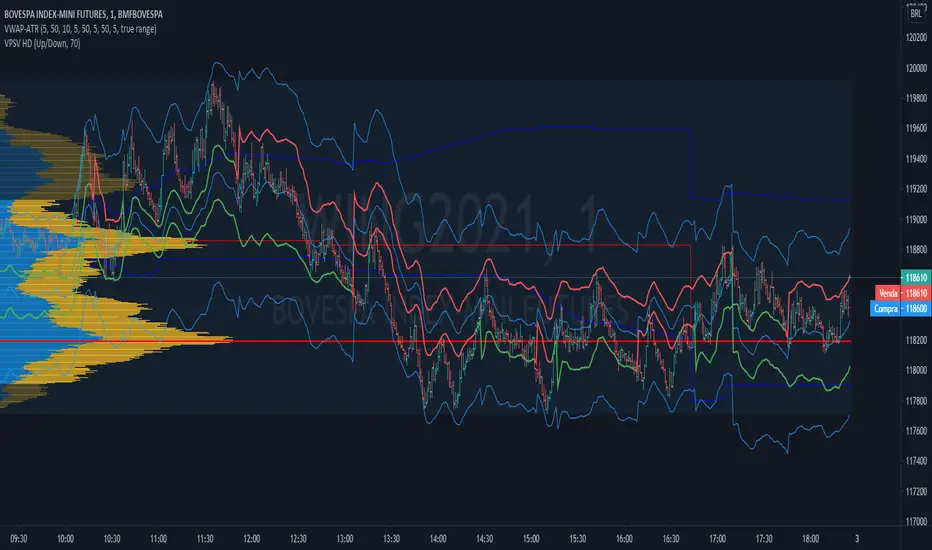
VWAP-ATR-SSLThis is an experimental idea to transform the original script created by @Fleite28 in a kind of SSL with volatility bands.
@Fleite28 has made all script and he have all credits, I just give him this idea.
I'm using this indicator to confirm:
1-potential bull trend (when you have 2x green lines with support)
2-potential bear trend (2x lines red - resistance)
3-consolidations (inside green support and red resistance).
Try to use this with a Market Profile Volume and some trend lines.
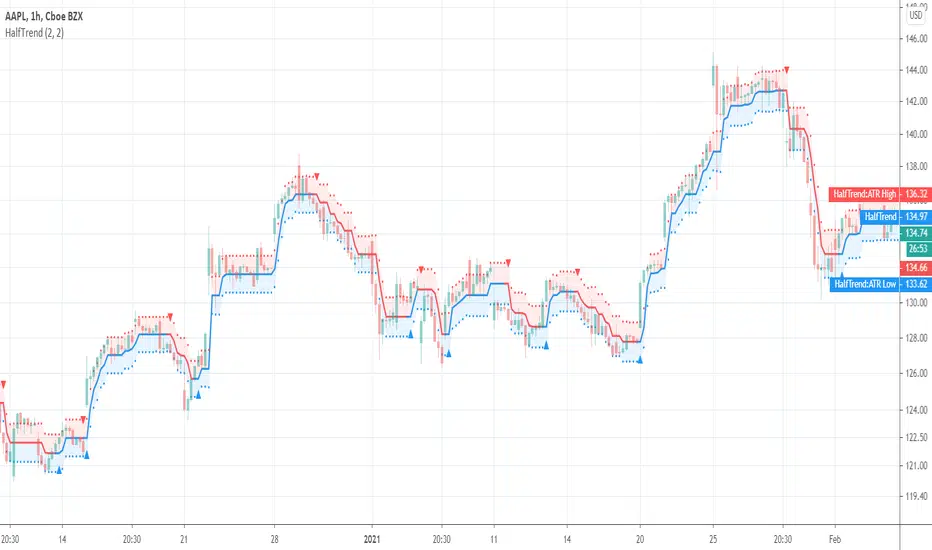
HalfTrendA popular trend indicator based on ATR. Similar to the SuperTrend but uses a different trend's identification logic.
I am publishing a disclosed code without license. Remember that in the future you may see a lot of paid IO scripts called BuySellScalper, Trend Trader Karan, Trend Trader and etc (by other authors) which will be based on this script. I found the same script on Ebay for $10 with a free shipping. Beware, always check and follow one Russian wisdom: "Do not pay for something you can get for free".
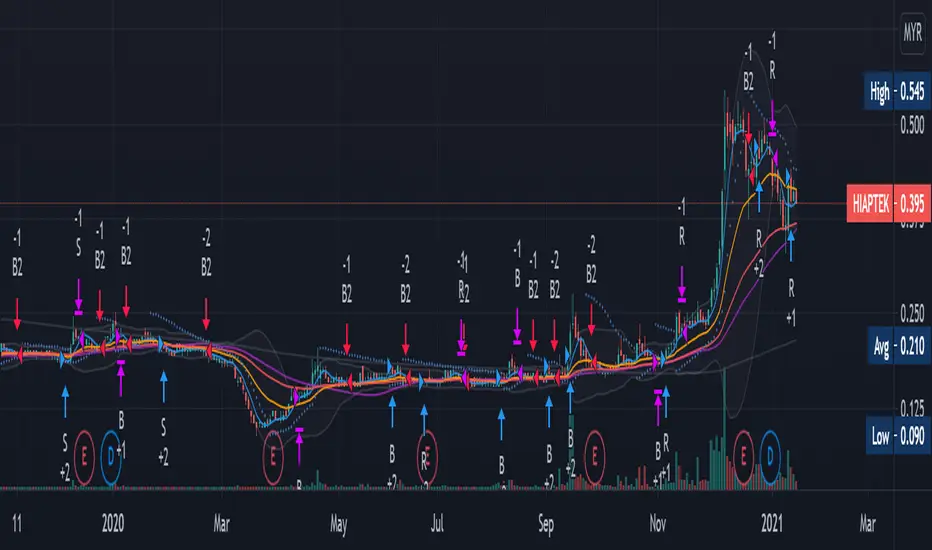
Renovation-10 (Including 10 Traditional Indicators)This idea is not rare. It is just a combination of 10 most well know and traditional Indicators to form one renovated indicator. There are Moving Average (MA), Volume (V), Bollinger Band (BB), Relative Strength Index ( RSI ), Stochastic RSI, Modified Stochastic RSI, Moving Average Convergence Divergence ( MACD ), Average directional index ( ADX ), Average True Range (ATR) and Parabolic Stop and Reverse (PSAR). These indicators most I found was just showing entering position strategic alone. I just want to know how well them work together when combination. I modified many times and thinking for the strategic enter and exist position with the choice of these 10 indicators to maximize the profitability which shows in strategic tester in every stock and conditions.
THEORY:
Fluctuation of price is like a Wave which I categorized it into four period. They are Sideway, Breakout Positive and Negative, Retracement and Consolidation. Breakout is rare to happen, either go up or go down. After a breakout usually will have small retracement, then trend will go for sideway. After long period of sideway, the wave is starting to run out of energy and there will be consolidation period.
STRATEGIC OPTION:
S: Sideway Period
B: Breakout Period
R: Retracement Period
(+): Buy
(-): Sell
PROBLEM:
1. Not performing very well at very penny stock which the graph looks like barcode.
Suggesting can change daily graph to weekly graph to avoid.
2. Be careful with Sideway entry signal because sometimes price may continue go down. You will stuck at middle if you enter without confirmation.
Confirm the price is stable at support by current low is higher or equal to past three to five day low before entry.
3.Always remember Breakout is rare, do not push for luck
Always make profit at Sideway and Retracement trend. Can Sell half only at BB when breakout buying signal is available, to avoid losing chance of chasing breakout.
4. Breakout selling signal 2 may delay
After breakout, make sure sell all when 2-3 red candle appeared or When BB is squeezing.
5. Other tools may required to confirm entry position.
These combination strategic is more to personal experiences and knowledges, it hard to adjust in coding for strategic position.
This is my first publication and I just do it for fun, having fun in reading the script and creating own ideas.
Information provided is only educational and sharing , should not be used to take action in the markets.
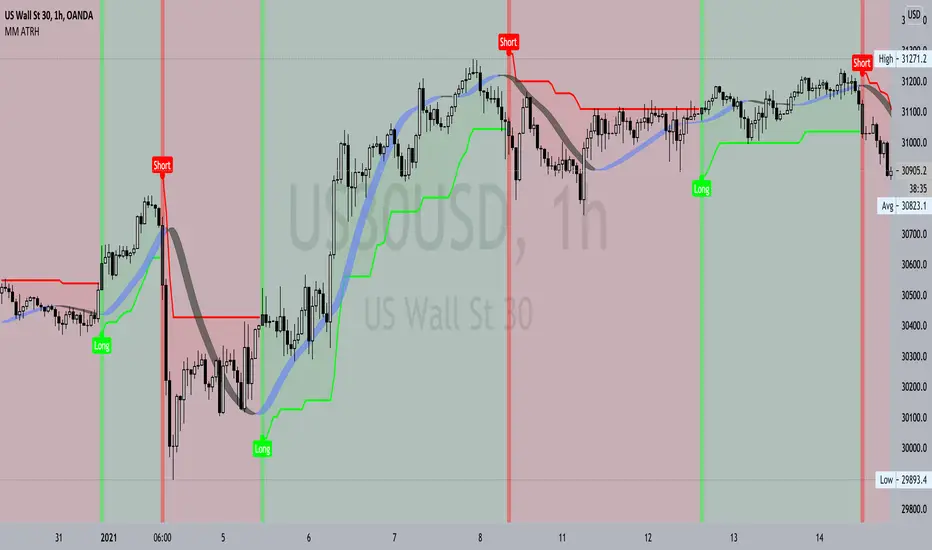
MM AverageTrueRangehUllFeatures:
- Powerful 2 calculation used in one. Average True Range Multiplier & Sensitivity.
- Clearly shows trend direction, volatility , momentum & sentiment of any financial market.
- Dynamic stop loss levels formed by the help of average true range calculation which are produce right from the long or short signal and does stretch until the opposite directional signal appears.
- Generates potential long and short trade signals using complex formula of volatility , momentum and trend following.
- ATR calculation method can be changed from normal (ATR) to SMA version true range inside setting by ticking or unticking the input function named “Change ATR Calculation Method?”.
- Long and short signals labels can be turn off/on using “Reveal Long/Short Signals?”. - Background color can be shown/hidden using “Signal-light Show/Hide?”.
- Alert feature available for long and short signals.
Important two main settings of ATRH indicator:
1. ATR Multiplier
o A retail trader should adjust the setting depending on the financial market, instrument and timeframe as per required.
o Basically, higher timeframe has more range in price so ATR multiplier can be set higher.
o ATR multiplier value lower can produce more signals which will be as more trades opportunities but it can also lead to fake signals. 3-5 value is producing reasonable signals in any timeframe either it be lower or it be higher. If a trader by mistake doesn’t set a proper input value then the whole indicator could even function poorly so this setting must be used wisely.
2. Sensitivity
o Sensitivity can be from 0 to 1. It can be also integer or floating-point number example: 0.1, 0.3, 0.8 etc.
o It is used to control the signal generation speed by 3 to 5 candle bars before (if the value is set higher) or after (if the value is set lower) during the time of condition meeting for either long or short signals.
o Depending on any financial market or instrument sensitivity value should be managed well by a trader for his/her needs taking consideration on the nature of that particular financial market or instrument & timeframe.
Use link below or PM us for access you this indicator. Happy Trading
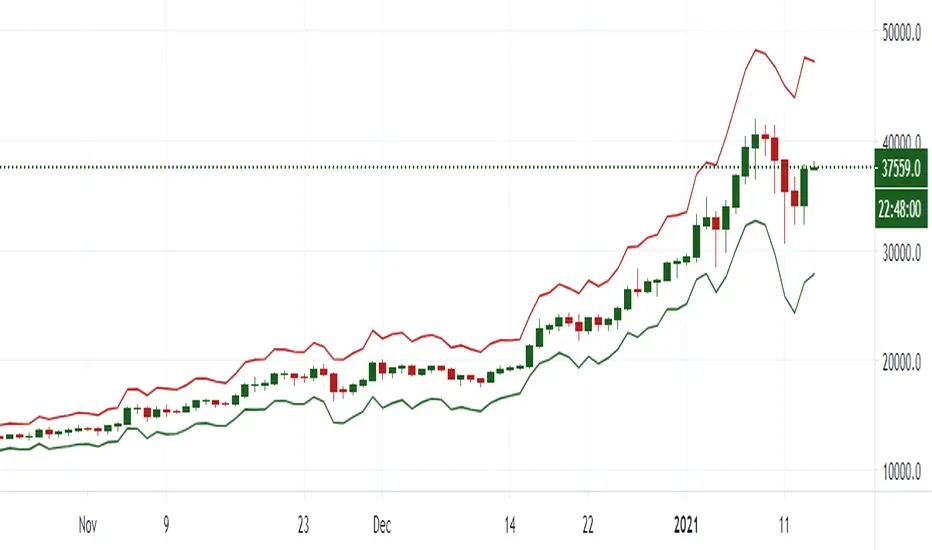
Running Bound based on ATR multiplierThis script basically uses default ATR and then
Multiplies with ATR multiplier (3 for crypto and 2 for forex) - you can change the values from the settings if you like
Adds/subtracts from the current price
And tries to find a bound on both side of price
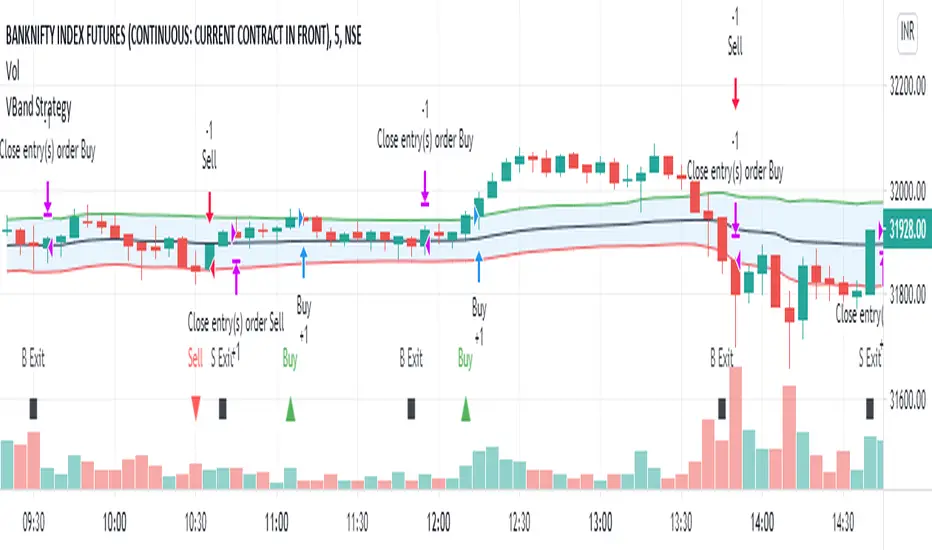
VBand StrategyVBand Strategy is simply used Vwap funcation and atr 14 for find the entry and exit points. This simple Strategy.
ATR Compression/expansionThe indicator is used to gauge the short term volatility of the instrument relative to its long term volatility.
The green columns of histogram represent lower short term volatility relative to long term, whereas Red columns of histogram represent Higher short term volatility relative to long term.
Higher the bar higher the strength of the signal.
This indicator is inspired by Matt Caruso's(Canslim Champion investor) chat on Richard Moglen's(Champion trading youtuber) podcast.

Phoenix085-Strategies==>MTF - Average True Range + MovAvgFIRSTLY, Here are a few who have influenced my pinescripting immensely recently:
@JustUncleL
@BigBitsIO
@TheArtofTrading
@QuantNomad
@SquigglesNiggles and many many many more.
Overview:
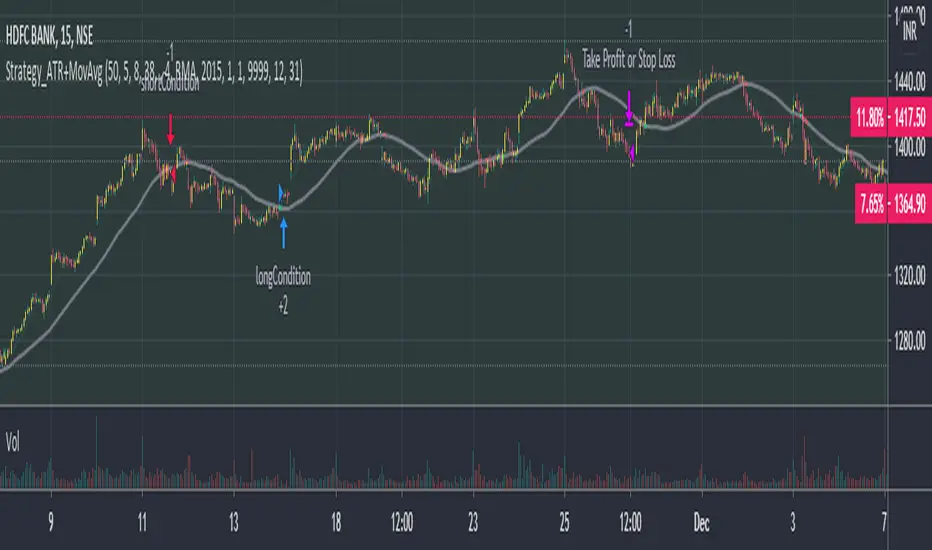
> This indicator is a simple crossover of Moving Averages.
> In addition I am using ATR rising as an indication for Trending Price.
> The entry is made once the smaller moving average crosses the bigger moving average, and also the Closes above the Smaller moving average.
> but the only twist here is,
- the ATR source is One timeframe Higher(In this case same as the session).whereas the source for the Moving averages is one Timeframe Lower.
>i.e., if the Session is 1D, the Indicator checks if the ATR is rising in the DAILY TIMEFRAME,
*_* the trade entry is made once the MOVING AVERAGE crossover happens on ONE TIME FRAME lower, as per example, ATR --> 1D = MA -->4H.
> Moving Average ->
- Thick -> Bigger MA,
- Thin and Transparent -> Smaller MA,
> Also, the Color of the Thicker MOVING AVERAGE Changes as Below:
- When LongCondition is satisfied --> Color=Lime
- When ShortCondition is satisfied --> Color=Red
- When neither condition is satisfied --> Color=Gray
NOTE:
1) There is a limitation in using the Securities function for FREE USERS --> Only 500 bars are allowed. So to use the indicators with more data, you need an upgraded TV account.
2) Strategy still needs Fine tuning, but for now, use the Thicker moving average color LIME FOR LONG ENTRIES and RED FOR SHORT ENTRIES.
This is Free for Use and share
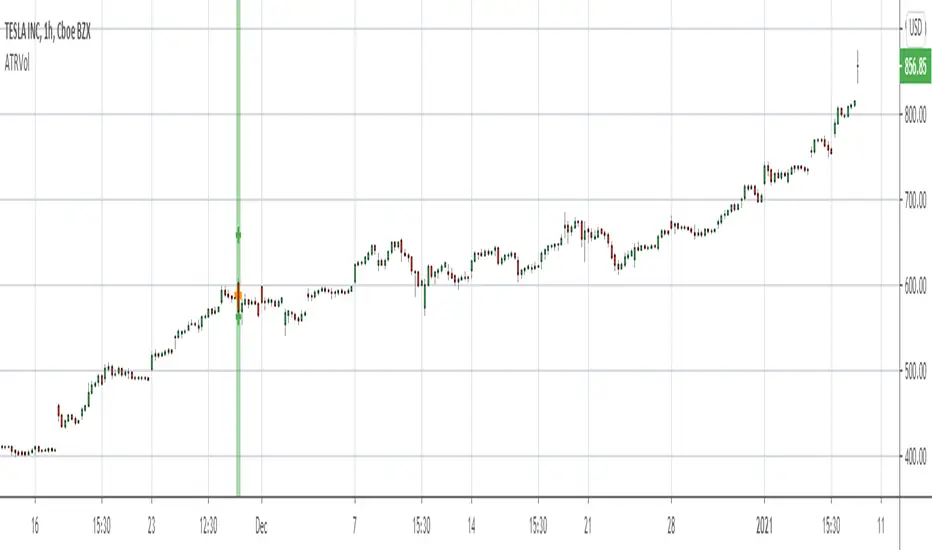
ATR Volatility Bars 1.0This script will be featured in upcoming video ideas about catching liquidations spikes in cryptocurrencies.
The script measures the unique size of each bar compared to the Average True Range (ATR) of the evaluation period. The evaluation period can be set in the inputs. The desired benchmark for what will be highlighted is also set in the inputs as a percentage. The default settings are to evaluate the last 26 bars for ATR and highlight bars that are 300% or larger than ATR.
When a bar meets the criteria of the indicator it will show a label and highlight the bar accordingly. The user may select the indicator to only show Buy or Sell opportunities. The indicator has alert functionality.
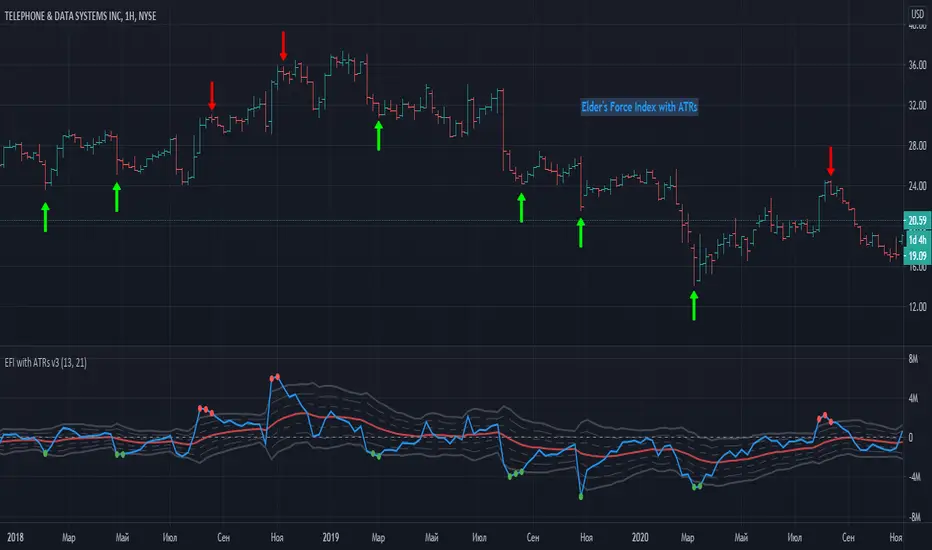
Elder Force Index With ATR ChannelsInspired by the new version of the "Force Index" announced by Dr. Alexander Elder a few years ago - "Elder Force Index With ATR Channels".
Unfortunately original version of script only works on MetaTrader platforms, so this is an attempt to
implement this great idea on TradingView too.
------------------------------------------------------------------------------------------------------------------------------------------------------------------------
Here is original script explanation by Dr. Elder himself
-------------------------------------------------------------------
Adding Average True Range (ATR) channels to Force Index had been suggested by Kerry Lovvorn.
Adding these channels turns Force Index into an excellent tool for identifying intermediate tops and bottoms.
Force Index with ATR channels does not catch all turns, but the ones it identifies deserve very serious attention.
Note: the word “true” in Average True Range refers to dealing with price gaps. Since there are no gaps in Force Index, here ATR is the same as the Average Range.
Whenever the Force Index rises above or falls below its 3-ATR channel, it signals that the ticker has reached an area of an unsustainable extreme.
That’s where rallies and declines become exhausted and prices tend to reverse. This is one of very few tools that are equally efficient in calling both top and bottom areas.
In our experience, these signals work especially well on the weekly charts.
Of course, users are welcome to experiment with them in any timeframe.
One possible option is to use the new Force Index with ATR Channels on your weekly charts and the original Force Index on your daily chart.
------------------------------------------------------------------------------------------------------------------------------------------------------------------------
- The Force Index is drawn in blue with a thick line.
- The Averaged Force is a solid red line.
- The upper and lower bands at 1 ATR are drawn in dotted lines.
- The upper and lower bands at 2 ATR use dashed lines.
- The upper and lower bands at 3 ATR are solid gray lines.
- Red dots placed above the plot when the EMA of Force Index rises above the 3-ATR channel.
- Green dots placed underneath the plot when that EMA declines below the 3-ATR channel.
***** Original script programmed to truncate values at the 4-ATR level to prevent any extreme value from flattening the rest of the plot -
- I'm not yet implemented this feature here - hopefully coming soon.
[JRL] ATR Pivot PointsThis indicator plots pivot points with support and resistance lines based on average true range (ATR). ATR is one of the best volatility and trading range predictors, so it can be very useful for finding confluence in any strategy.

Indicator - ATR Profit Loss - DGHi Traders,
This is an on chart indicator that can be used for setting take profit and stop losses very easily using the Average True Range Indicator (ATR). Using a volatility adjusted TP and SL will allow you to set your targets and losses based on market conditions. In the settings, you are able to adjust how much of a multiplier you require depending on your risk tolerance and strategy. For those that follow the NNFX method, the defult settings are preset to 1xATR TP and 1.5xATR SL.
How to use:
- For longs, 'isLong' box must be ticked, for shorts, this box is unticked
- For longs, green line is TP, red line is SL
- For shorts, red line is TP, green line is SL
Regards,
Dillon Grech

EMA ATR Engulfing CandlesThis is good old EMA (Exponential Moving Average) with a twist. The EMA line is surrounded by ATR on either side giving you visibility on how market breadth is working out.
The icing on this cake is in the form of engulfing candle indications. Whenever the engulfing candle happens to be inside the size (that's upper and low ATR area limits around EMA) and the engulfing candle has closed in the appropriate direction, the signal triangle comes up. To understand this...
The signal appears only if one of OHLC price point of engulfed and/or engulfing candles are within upper and lower ATR areas around EMA
When there is a bullish engulfing candle, and the close of the candle is above EMA, a green triangle comes up below the candle
When there is a bearish engulfing candle and the close of the candle is below EMA, a red triangle comes up above the candle
The settings enable you to set the following
Length of EMA (default is 200)
Length of ATR (default is 12)
Resolution of EMA independent of the chart timeframe (default is Daily)
Price type (default is hlc3)
Trade zone width in number of ATRs on either side of EMA (default is 1)
Other settings to adjust display
I have been using this in different timeframes to generate signals and found that it generates pretty good alpha.
Feel free to write to me if you have any ideas that can improve this further or if you wish to discuss how to properly use this.

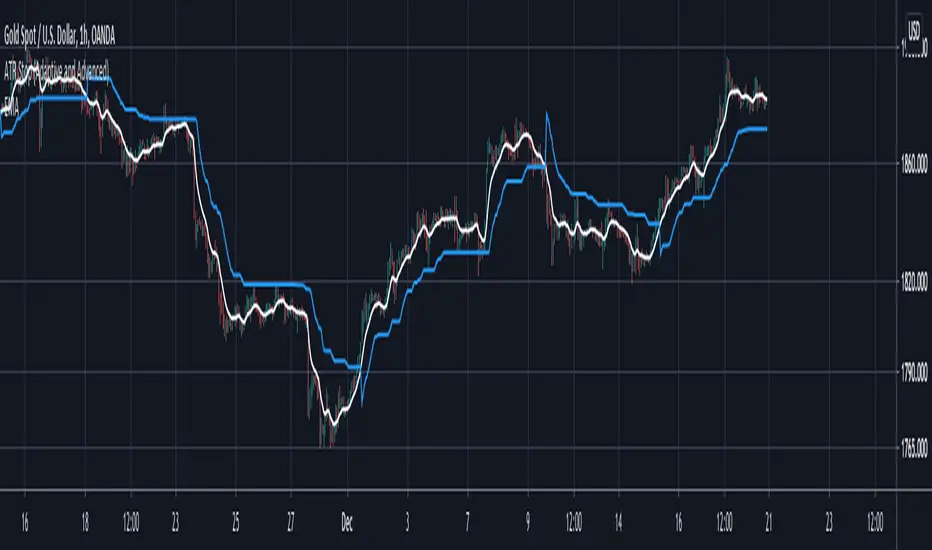
ATR Stop (Adaptive and Advanced)Hi everyone I am excited to share with you all a tool that has been in a lot of my research lately I and think would greatly benefit everyone.
In the last years I have fallen in love with ATR stoplosses/ stop and reverses. However all the ones offered in the community lacked the features that I wanted to have, so I built them all myself and want to share them with you all today!!!
Assuming that you are already familiar with ATR stops, here is what is new and improved with this version:
1. This script takes anything as an input! As you can see in the chart above I have used an EMA as an input into this script and this greatly smoothed out the results while still allowing for phenomenal entries with minimal whiplash. You can use this tool on anything now, from moving averages to oscillators.
2. Previous scripts were not adaptive, you can now choose how adaptive this script is! Increasing this number allows this ATR stop to follow price when it is running away so you don't have to give back much profit. Likewise it makes sure that the ATR stop slows down when the market is ranging so you wont get randomly stopped out.
3. You can now get it to start at the exact moment you enter your trade! Previous scripts had the ATR stop running forever which wasn't helpful if you only needed it for your own trades. You can now set it to start at the exact time of your trade if that is the only time you need it!
4. Now you can easily get alerts when the ATR stop gets hit.
Hope this helps you all!
ATR Stop [COFUTrading]ATR excluding price spikes for a more correct calculation of average volatility and setting a stop loss.

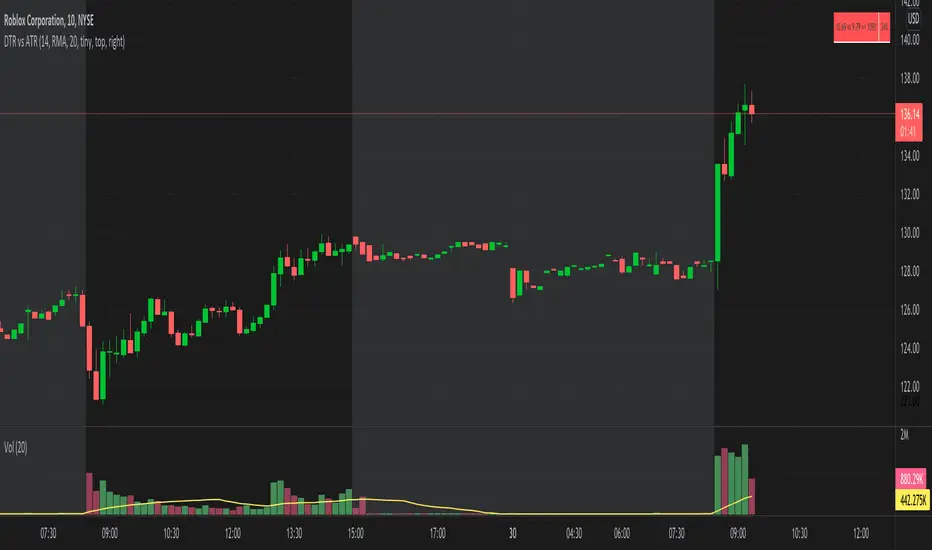
DTR vs ATR w RVolDTR vs ART along with Relative Volume in Percentage. So if you see RVol as 200% with input length of 10 days, today's volume is 2x compared to past 10 days. It helps if today's volume is already reached 20% or 30% within 30mins of market open, etc.
ALMA PPO with Volume Weighted ATR BandsAlma PPO with a percentile eq and atr bands using volume weighted alma. Volume weighted alma idea from rumpypumpydumpy. All code is from the open source library.

PMax on RSI with Tillson T3Profit Maximizer Indicator on RSI with Tillson T3 Moving Average:
PMax uses ATR calculation inside, for this reason users couldn't manage to use PMax on RSI because RSI indicator doesn't have High and Low values in bars, but ATR needs that values. So I personally calculate RSI in a different way to have High and Low values of RSI wrt price bars.
IMPORTANT:
Because of the sudden movements and divergences on RSI, this indicator must firstly optimized for the charts before using. Optimization can be held by users for the meaningful parameters for each chart.
3 parameters are critical when optimizing:
First: Multiplier
Second: Tillson T3 Length
Third: T3 Volume Factor
Here are some information about Profit Maximizer:
PMax Indicator:
PMax Screener and Strategy:

MACD Strategy with trailing ATR stopThis is a trend based strategy that uses EMA and SMA intersection for determining the direction of the trend and MACD for the entry signal. At the same time, the strategy uses ATR, which is working as a trailing stop.
The strategy entry will work when the Trend ribbon will turn green and MACD line will crossover the signal line. This strategy also takes into account the pyramiding and allows to enter the second time if the signal will repeat itself.
There are 3 exit points. The first 10% of the position will be closed when the price will increase by 1%. The second portion of 50% will be closed when the price reaches 5% Take profit target. The remaining 40 % of the position will wait for the exit signal which will occur when the price closes below the ATR line.
The strategy is using a fixed amount in dollars, each time the entry occurs the strategy will enter with 100$ in the order.
The strategy can be applied to other crypto assets. However, they will require input changes.
Best of luck with your trading.
