Show ATR and 1st hour high+low1. Shows TR at daily bars
2. Shows ATR lines intraday: 100% and 75% (customizable)
3. Shows hint with ATR for current day and percent passed
4. Show high and low of the 1st hour
ATR

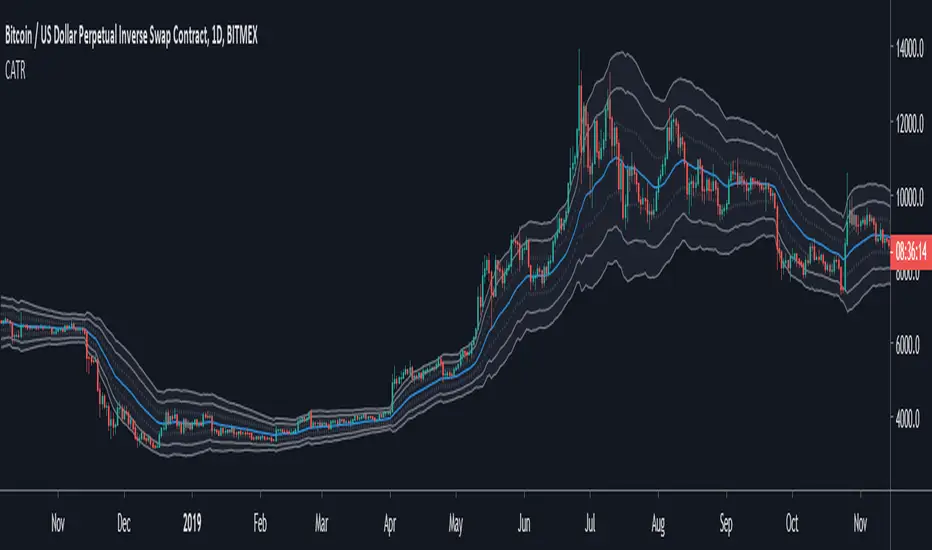
Channel ATR1 - What is the Channel ATR indicator
This is an envelope indicator (like the Bollinger bands indicator) used to evaluate how much the price diverge from it's moving average.
This indicator can be used as a system on it's own. I recommend to use it when the market goes side way, although, you can also use it when the market is trending.
What makes this indicator so relevant and reliable ? The use of the ATR to build the envelope. Read below if you wan to know more.
2 - How is the Channel ATR computed
The main component is an EMA. The envelope is made of 3 layers, each is the Average True Range, plot at a multiple distance from the EMA (1*EMA, 2*EMA, 3*EMA) . If you don't know what is the ATR, it's basically a measure of the volatility (you can read more about it here ).
Each layer of the envelope is a multiple of the measure of the volatility. Let's see how to use it.
3 - How to use the Channel ATR indicator
You can use this indicator in different strategies :
- Return to the mean: When the price goes out of the envelope, it's an excess of the market. You can take advantage of this by betting to a return to the EMA value.
- Trend following : If the market is tending, you can buy/sell when the price touch the EMA and place a target at another level in the envelope.
- Stop loss: Since each envelope layer is built from the ATR (i.e. the volatility), you can use it to place your stop at least at 1 ATR from your entry, to not be hit by the market noise.
- Find your own way : The Channel ATR is a very rich and powerful indicator, you can try to built your own trading system on the top of it.
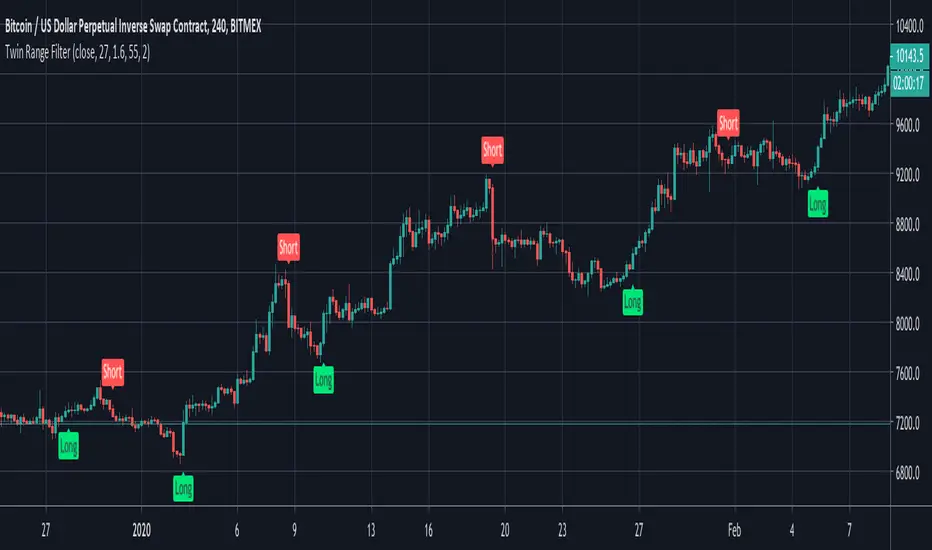
Twin Range FilterAn experiment to combine two range filters and plot the average of both to smooth out the signals.
This works significantly better than the typical ATR set-up, but there's still too much noise here to set and forget with bots. Use it as the basis of your own system with additional filtering on top.
ATR %Displays ATR percentage with 2SD. When value is greater than 12% I consider the stock as highly volatile
Long Wick TrialI've created this as a confirmation indicator to help know when market conditions are favorable to enter a trade. It measures volume, volatility, and ATR. It is not intended to tell you when to enter/exit the market, but use it with another indicator such as the mirror macd to filter out many losses and avoid entering the market during low volume or excessive volatility that may trip your stop loss.
Green = Favorable Market conditions
Yellow = Enter with caution, the market is moving sideways but is slightly trending
Orange = Enter with caution, the market is trending but extremely volatile and may trip stop loss early
Black = Shouldn't enter market here, market is moving sideways and volume is also low.
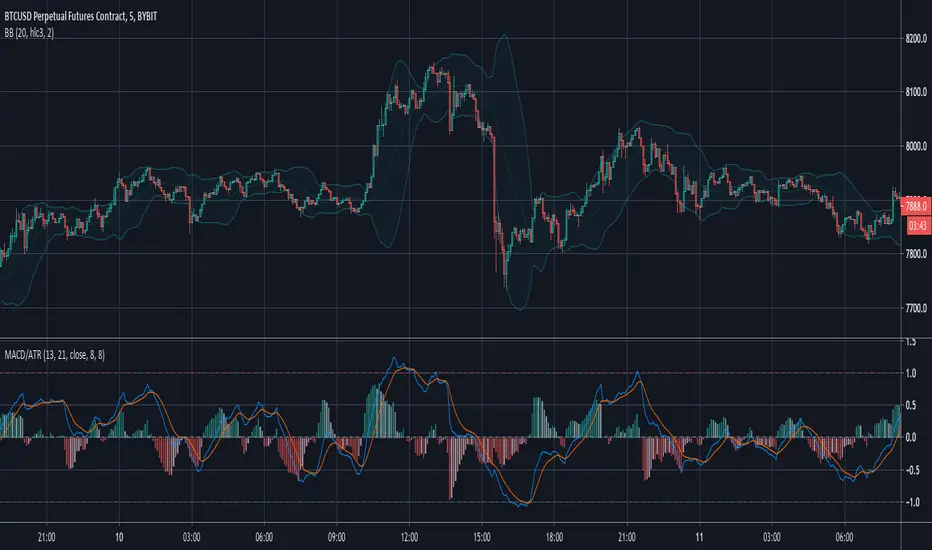
MACD/ATRThis indicator is a restricted MACD .
I reached this with a little trick: I devided it by ATR . This way it is most of the time inside the -1..1 range. It depends on the length of the ATR's period. If it is greater, the probability of outliers is greater.
With this indicator you can use cerain levels of MACD and its histogram as a trigger.
Share with me if you found it useful.
[mya] ATR FilteredATR Filtered for NNFX trading.
A classic Average True Range (ATR) indicator with a simple feature to filter out the spikes.
The ATR value is the tool to determine your TP and SL on daily time-frame, specifically in the NNFX way of trading.
VP mentions in his podcast that when the ATR spikes up you have 2 options: 1. wait 14 candles for the ATR to normalize, 2. use the ATR value prior to the spike.
ATR spikes are easy to spot (thus easy to exclude) for an itraday flash crash.
On the other hand when volatility increases over several candles (as in the Covid-19 shock) it can be difficult to determine which ATR value to base your TP/SL on.
In definition of standard deviation, 95.4% of the value will fall within the 2 sigma bands. Therefore the rest 4.6% can be filtered out as an extreme value (a spike).
The ATR in this indicator will plot the standard ATR value in normal condition, then when the ATR spike happens it will stay at the highest value at the point, when the ATR exceeded its 2 sigma band.
The filtering will reset when the ATR comes back down below the extended highest value.
*Disclaimer: Use at your own risk. I am not a programmer, just another guy trying to beat this game. Let's go get it.

BEST ATR Stop Multiple StrategyHello traders
Here we go again.... with another strategy snippet.
Reminder: it's an alternative of this Trailing Stop strategy script
Entry logic
The entry is based on a Simple Moving Averages (SMA) cross.
This part doesn't matter here - as I wanted to focus on the ATR multiple stop loss component.
ATR STOP
This strategy snippet uses an entry stop loss defined based on a multiple of the average true range value.
The soure code detects ATR value at entry price, applies the multiplier and will set a static (= non trailing) stop-loss to each position
A pinescript v4 label will appear for each new signal displaying the ATR*multiplier value at signal time
All the BEST
Dave

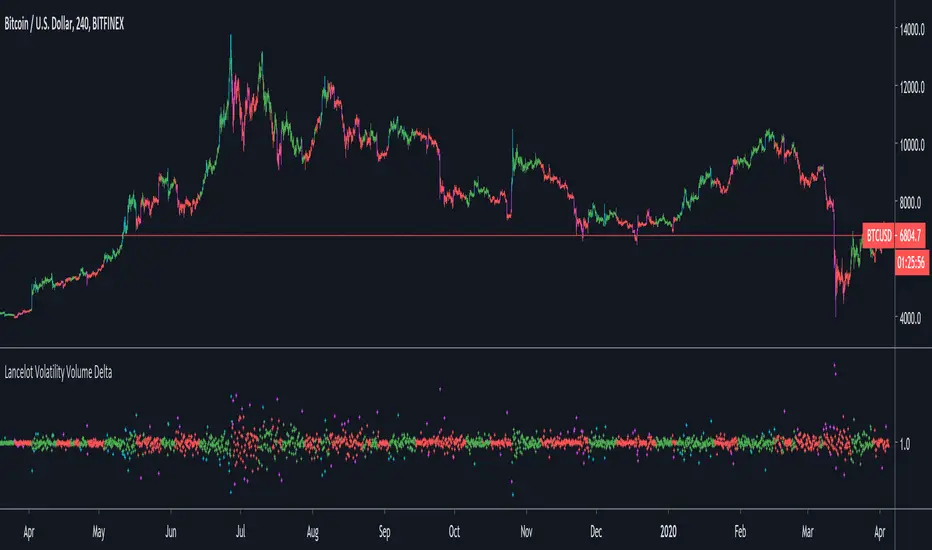
Lancelot Volatility Volume DeltaThis indicator calculate the delta of the volatility adjusted on-balance volume.
This could be use as a filter or trigger in a system.
Chonky ATR LevelsChoose any custom ATR settings (smoothing, period, time frame, lookback)
and project daily high/low with current daily high/low values

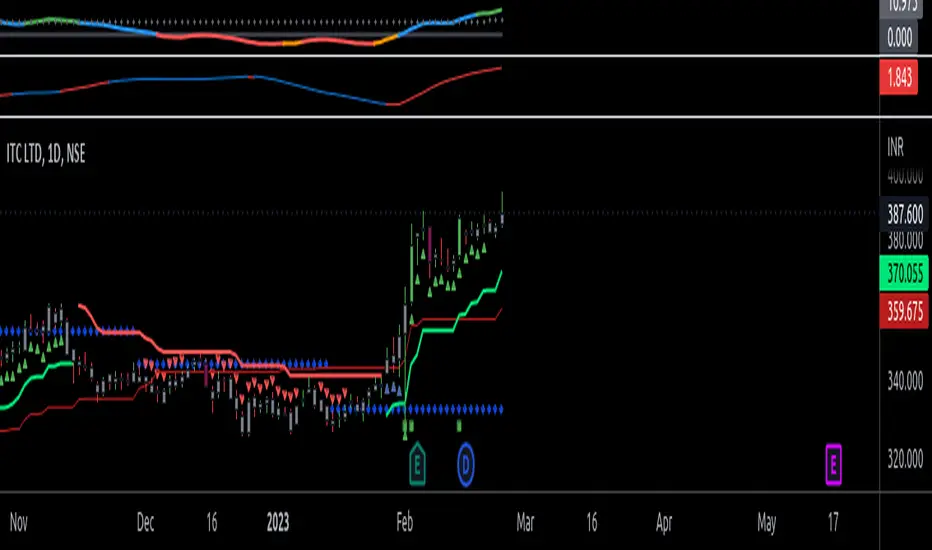
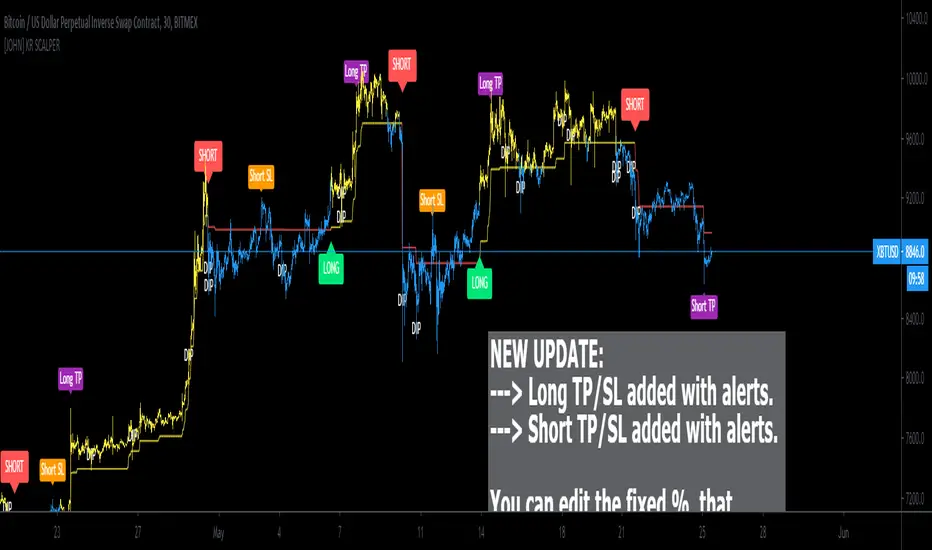
[JOHN] KR SCALPERHello this is KR SCALPER indicator. (work on crypto market)
---------------------------------
How this indicator work?
KR SCALPER script work with bollinger bands, price volatility and ATR (average true range).
This system provide
- HIGH QUALITY BUY/SELL Signals with a reasonable ROI.
- DIPS noted on chart with "DIP" TEXT, thanks to the use of bbands parameters.
- Work in cryptocurrency market, tested with top 10 coins, with good results.
- Tested on LTF (from 5m to 1h), work even on 4h, 1d.
How use it?
Indicator is setup for cryptocurrency. You can long and short by following the indications below:
GREEN LABEL = LONG
RED LABEL = SHORT
DIP noted on chart
This system write on chart with "DIP" text whenever a decrease of price/selloff occour, usually a good place to make attention if you are looking for a trade.
This is possible with the use of Bbands that helped me on this add.
Below some timeframes examples.
5 minute chart
15 minute chart
1H timeframe chart
4H timeframe chart
Below ETH USD 4H timeframe chart for reference.
----------------------------------
I hope you like and enjoy.
Good trading traders!
[HM] VWAP Envelope dinamic intraday v1- VWAP, volume weighted average price;
- Plus Envelope bands:
1) Dinamic, adjusted by volatility:
- - - daily ATR or
- - - daily Standard Deviation
2) or simple fixed % increments bands, defined by user.
# Intraday timeframe only.
# If volume data is absent, the indicator will not work at all.
Hope this could help the community.

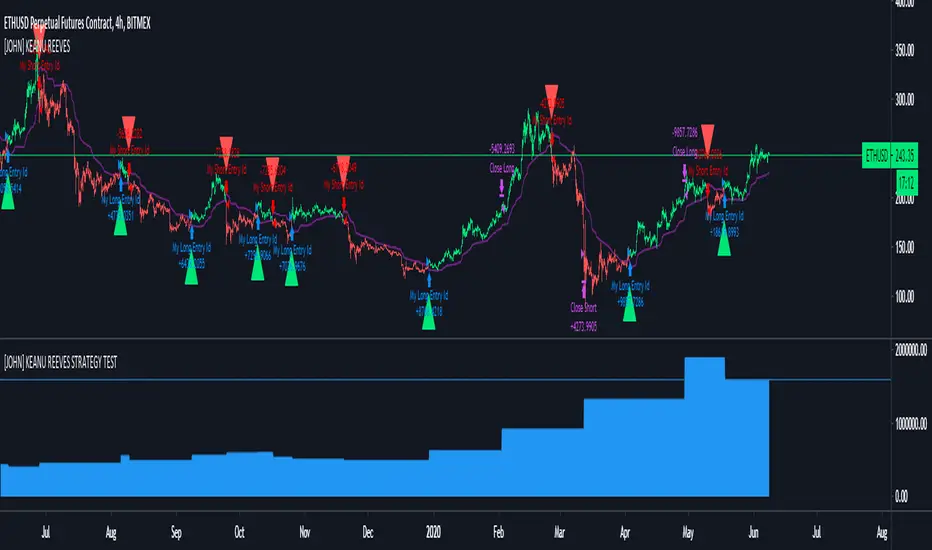
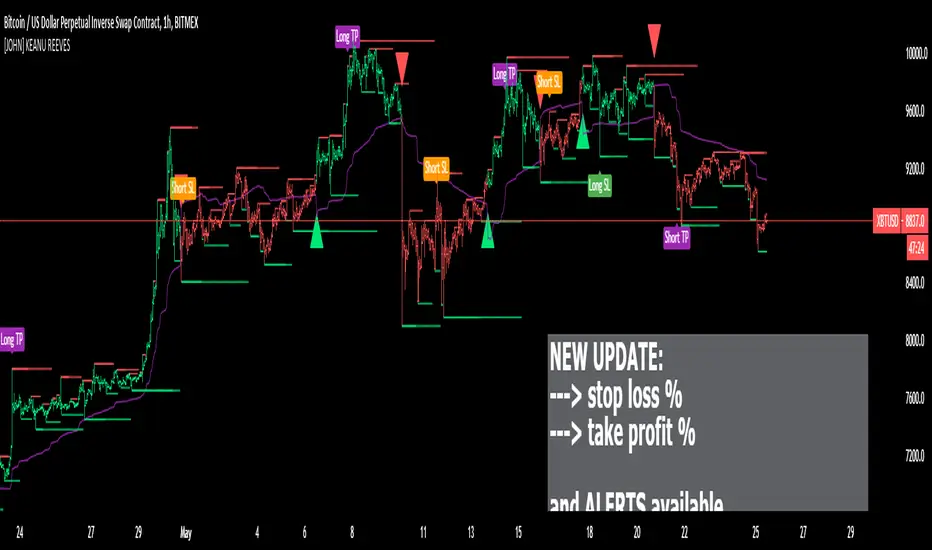
[JOHN] KEANU REEVESHello this is KEANU REEVES indicator. (Ideal for crypto)
---------------------------------
How this indicator work?
KEANU REEVES work with ATR, integrated with high and low system.
Support/resistance area as high/low. Check the images below.
This system provide high profitable signal with every pair and coins, with all timeframes.
Below last daily signal ROI
BITCOIN
ETH ROI
Some other timeframes WEEKLY AND H4 Bitcoin chart
Some other exmple EOS and ETH other perspective (different parameters)
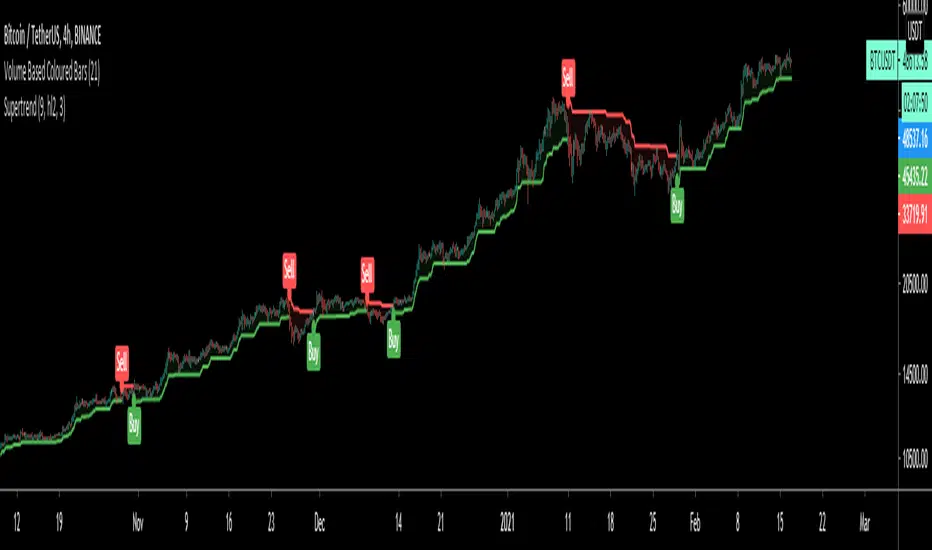
SuperTrendSuperTrend is one of the most common ATR based trailing stop indicators.
In this version you can change the ATR calculation method from the settings. Default method is RMA, when the alternative method is SMA.
The indicator is easy to use and gives an accurate reading about an ongoing trend. It is constructed with two parameters, namely period and multiplier. The default values used while constructing a superindicator are 10 for average true range or trading period and three for its multiplier.
The average true range (ATR) plays an important role in 'Supertrend' as the indicator uses ATR to calculate its value. The ATR indicator signals the degree of price volatility.
The buy and sell signals are generated when the indicator starts plotting either on top of the closing price or below the closing price. A buy signal is generated when the ‘Supertrend’ closes above the price and a sell signal is generated when it closes below the closing price.
It also suggests that the trend is shifting from descending mode to ascending mode. Contrary to this, when a ‘Supertrend’ closes above the price, it generates a sell signal as the colour of the indicator changes into red.
A ‘Supertrend’ indicator can be used on equities, futures or forex, or even crypto markets and also on daily, weekly and hourly charts as well, but generally, it fails in a sideways-moving market.
I had converted Supertrend indicator code for various platforms like Metastock in 2017, but in this TradingView version special credit goes to everget - Alex Orekhov which gave a great inspiration to look my indicators better with highlights, signals and alarms. Thank you Alex.
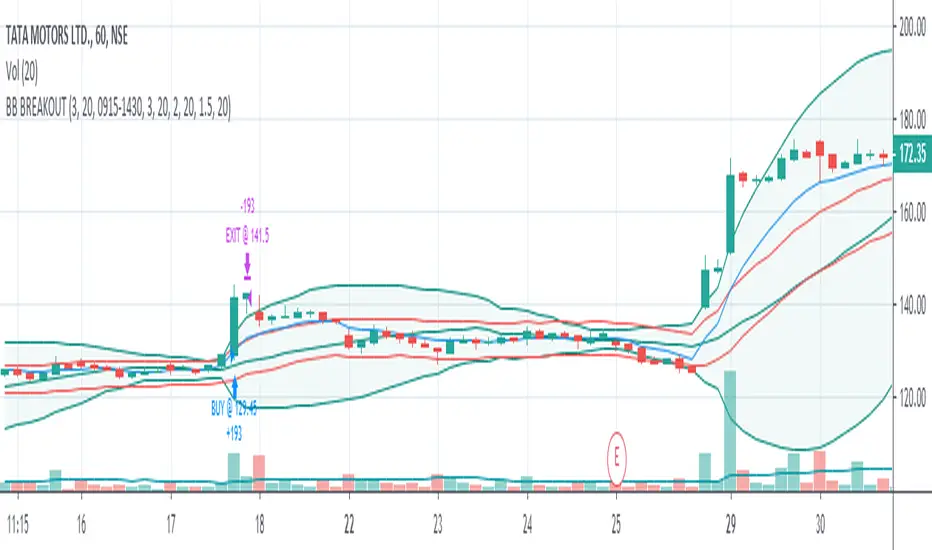
[C] Dynamic Range Channel based on ATR on Multi Time FramePlots the dynamic range from the calculated Average True Range of the security. The calculated price that it could return to from high to low and vice versa. Has been tested on multiple time frames on NSE equity stocks.

ADR price targets with alert options- UltimateADR based price targets with option to hide past levels..
TS ATR & PS (MA)Similar to my previous post, this strategy involves trailing stops based on ATR calculation, EMA and WMA. It produces a better result with less cum.loss due to trailing stop nature.
Link to my previous post -

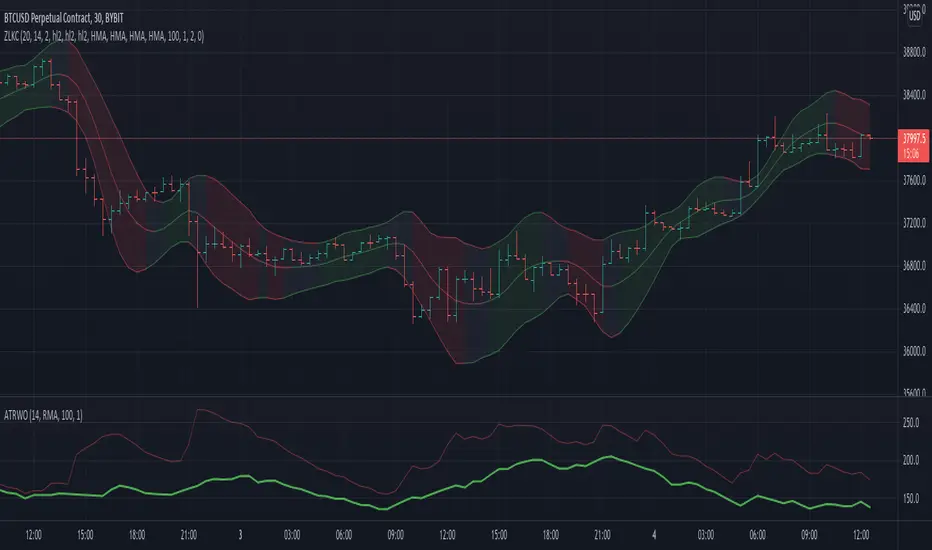
Zero Lag Keltner ChannelsThis is Keltner Channelz (KC) with Zero Lag Moving Average (ZLMA as base). It is smoother and has less lag than the original (EMA/SMA) variant.
It also can be used as a trend indicator and trend confirmation indicator. The upper and lower bands are green if it is an up trend, and red if a down trend. If both have the same color it is a stronger trend.
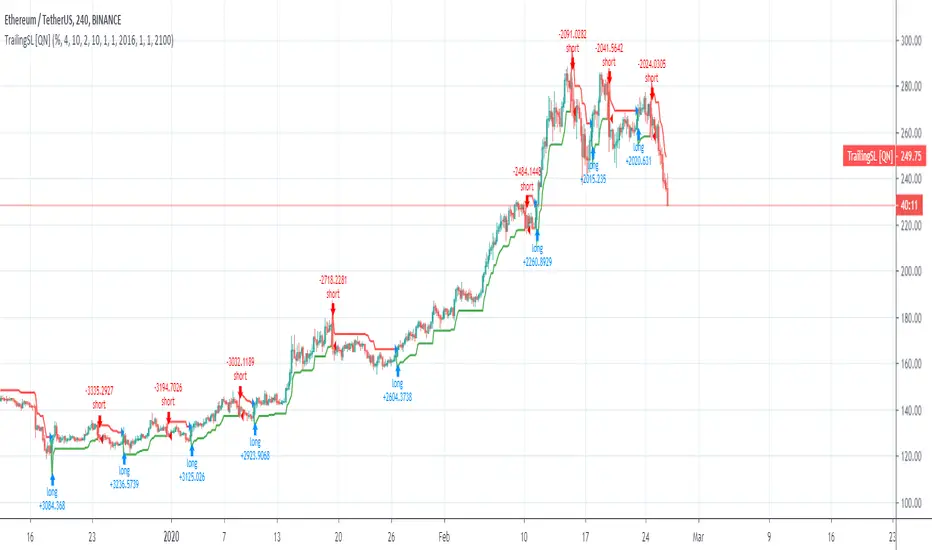
Trailing SL Strategy [QuantNomad]I'm a big fan of simple strategies.
This one is a very simple one. So it consists only from one Trailing SL. When SL is hit, the position is reversed and SL is tracked for a new position.
You can choose one of 3 types of SL:
% of your price
ATR - it is calculated as current ATR * multiplier
Absolute
As you can see even this simple strategy can show pretty good results.
ATR based Stop and Take-Profit levels in realtime Little tool to quickly identify stops and take-profit levels based on Average True Range. User can change ATR multipiers, as well as the ATR length used. Green and red lines show these levels; plot is visible over last 8 bars only to reduce clutter. Label showing the current ATR, up above the last bar

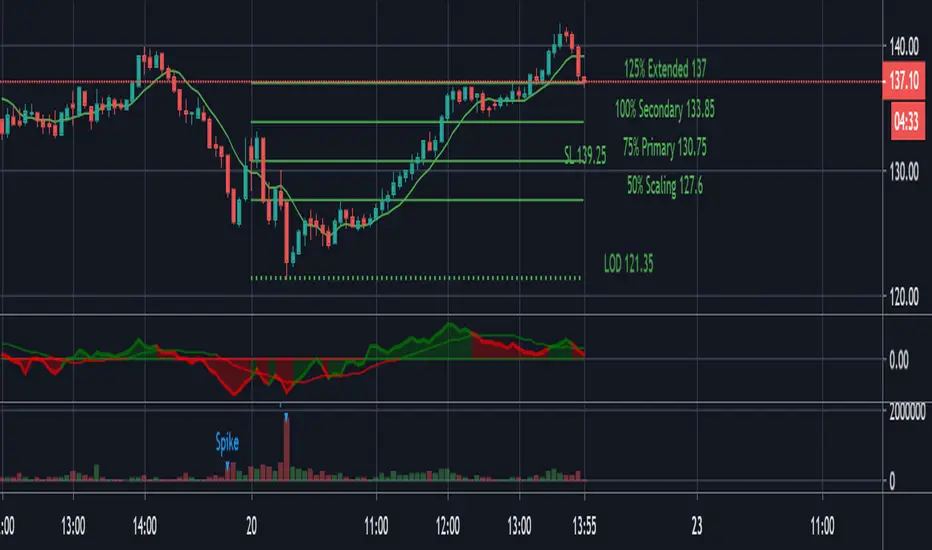
Advanced ADR - PivotBossThis Script comes straight from PivotBoss Masterclass. Script calculates compression and expansion of prices. ADR is calulated for user defined period and it is compared over 10 period. If the prices goes over 125% of average ADRin the look back period then current price is over expanded and reversal is in the corner. When Prices falls below 65% of average ADR then prices are under compression. Then you should look to position yourself in the direction of the expansion.
Expansion leads to compression. Compression leads to Expansion
