Multi-Timeframe Stochastic (4x) z Podświetlaniemnowy skrypt bez etykietek o wyprzedaniu i wykupieniu
中心震盪指標
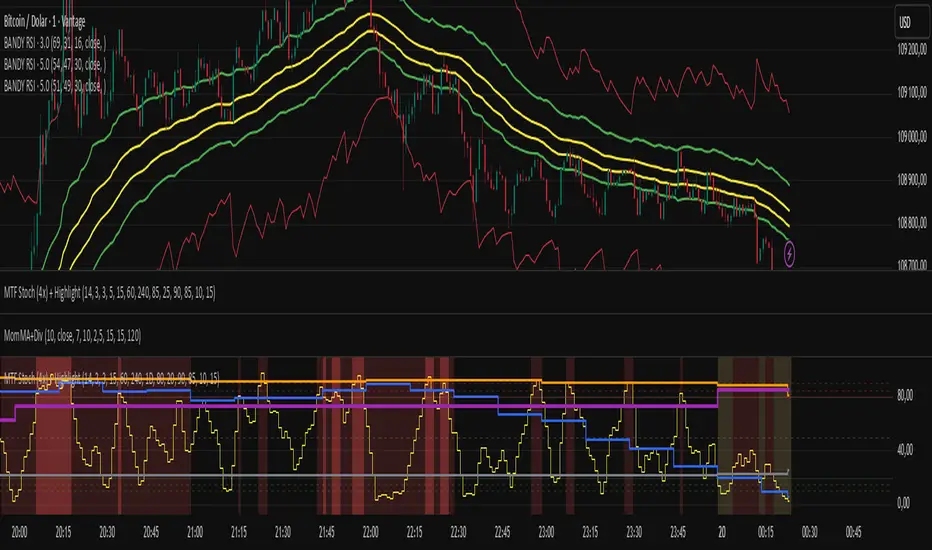
Multi-Timeframe Stochastic (4x) z PodświetlaniemStochastic z możliwością paru tfów gdzie jak są w danej strefie to podświetla
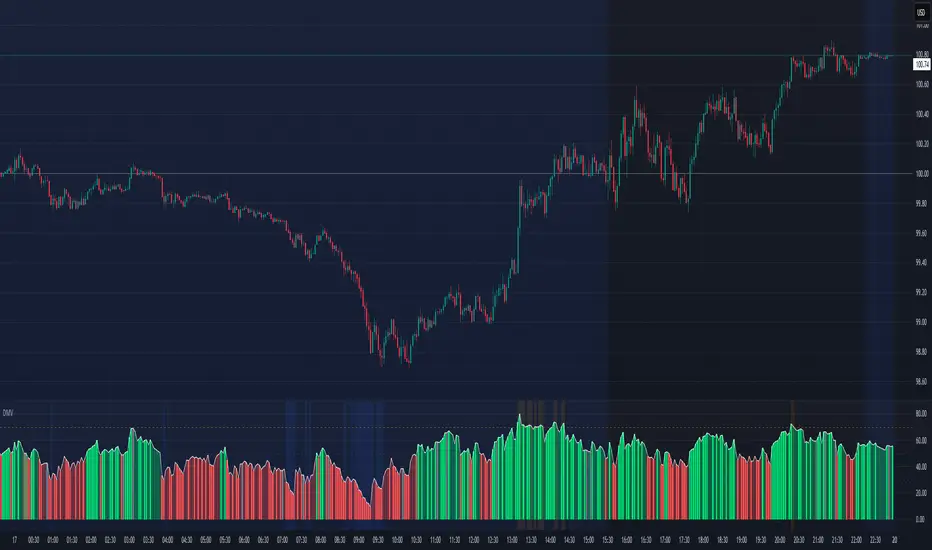
Directional Momentum VisualizerDescription
This script provides a color-coded column visualization of a classic momentum oscillator that measures relative strength and weakness. Instead of a single line, it uses conditional coloring to make directional changes easier to identify at a glance.
The tool is designed for clarity and adaptability, offering both column and line displays, with optional overbought, oversold, and midpoint guides.
How It Works
The script evaluates the oscillator’s value relative to a midpoint and its previous reading.
Depending on whether it’s above or below the midpoint — and whether it’s rising or falling — each column changes color:
Strong upward momentum (above midpoint and rising) → bright green
Fading upward momentum (above midpoint but falling) → pale green
Strong downward momentum (below midpoint and falling) → bright red
Fading downward momentum (below midpoint but rising) → pale red
Unchanged from the previous value → gray
This structure makes momentum shifts instantly visible without relying on line crossings or alerts.
Key Features
Color-coded momentum columns for instant visual interpretation
Adjustable midpoint, overbought, and oversold levels
Optional line overlay for smoother reference
Dynamic background highlighting in extreme zones
Works on any symbol or timeframe
Inputs Overview
Length: Controls the sensitivity of the oscillator calculation.
Source: Selects the price source (Close, HL2, etc.).
Midpoint Level: Defines the central reference level separating bullish and bearish momentum.
Show Line: Toggles visibility of the traditional line overlay.
Overbought / Oversold Levels: Define upper and lower boundaries for potential exhaustion zones.
How to Use
Add the script to your chart from the Indicators tab.
Adjust the midpoint and level settings to fit your preferred configuration.
Observe how column colors shift to reflect strength or weakness in momentum.
Use these transitions as visual context, not as trade signals.
How it Helps
This visual approach offers a clearer perspective on momentum dynamics by replacing the traditional single-line display with color-coded columns. The conditional coloring instantly reveals whether momentum is strengthening or weakening around a chosen midpoint, making trend shifts and fading pressure easier to interpret at a glance. It helps reduce visual noise and allows for quicker, more intuitive analysis of market behavior.
This tool is intended purely as a visual aid to help identify changing momentum conditions at a glance. It is not a buy or sell signal generator and should be used in combination with other forms of analysis and sound risk management.
⚠️ Disclaimer:
This script is provided for educational and informational purposes only. It is not financial advice and should not be considered a recommendation to buy, sell, or hold any financial instrument. Trading involves significant risk of loss and is not suitable for every investor. Users should perform their own due diligence and consult with a licensed financial advisor before making any trading decisions. The author does not guarantee any profits or results from using this script, and assumes no liability for any losses incurred. Use this script at your own risk.
CE+ZLSMA RovTrading StrateryThe strategy is optimized for scalping in small timeframes like M15 and M30, as well as M5.
It combines two indicators: CE and ZLSMA.
Try it now!

MILLION MEN - Sheep HunterWhat it is
MILLION MEN – Sheep Hunter is an RSI-based context tool designed to visually highlight extreme sentiment zones. It draws Overbought (herd/FOMO) and Oversold (panic/liquidity) boxes on price, and labels rare events (Whale / Wolf / Sheep / TP10) for easier discretionary analysis. It is not an entry signal generator, but a tool to understand crowd behavior at extremes.
How it works
RSI core: Adjustable length and custom OB/OS thresholds.
Zones:
• Red box = RSI between 80–90 (overbought pocket)
• Green box = RSI ≤ 20 (oversold pocket)
• Box height auto-scales using True Range for clear visibility
• Boxes persist for X bars after exit, keeping context visible
Marks (optional):
• Whale (deep oversold)
• Wolf Entry (oversold threshold)
• Sheep (extreme FOMO)
• TP10 (RSI ≤ 10, potential exit area)
How to use
Use zones and marks as context or confluence, not automatic entries. Oversold areas may hint at exhaustion or liquidity grabs; overbought areas can warn of crowd chasing tops. Combine with structure, HTF bias, volume or price action.
Originality & value
Unlike standard RSI lines, this tool projects extremes directly onto price with persistent, padded zones and minimal marks for clarity. It helps traders see sentiment pockets over time, rather than momentary RSI spikes.
Tested markets
This tool has been primarily tested on major crypto assets (BTC, XRP, ETH, BNB, LTC).
Behavior on other markets may vary and should be validated before use.
Limitations
RSI can stay extreme during strong trends.
Marks are context labels, not buy/sell signals.
Non-standard chart types are not supported.
No future data is used. This is not financial advice.
يعرض مناطق تشبع شرائي/بيعي على السعر مباشرة (صناديق حمراء وخضراء) مع علامات لحالات قصوى مثل Whale / Sheep. الهدف هو فهم سلوك السيولة والجمهور عند التطرف وليس إعطاء إشارات دخول مباشرة. تمت تجربة الأداة على العملات الرئيسية (BTC, XRP, ETH, BNB, LTC) وقد يختلف الأداء في الأسواق الأخرى.

Stochastic Clean & ClearA simple yet sharp take on the Stochastic Oscillator, built for traders who want to read momentum cleanly without extra clutter.
💡 Main Features:
Dynamic %K and %D line colors — green for bullish momentum, red for bearish.
Auto dots appear whenever %K crosses %D, so you’ll never miss a signal.
Clearly marked overbought (80) and oversold (20) zones with a soft transparent background.
Adjustable smoothing parameters to fit your trading style.
🎯 Perfect for traders who rely on price action + momentum, especially on intraday and swing timeframes.
Minimalist design, no noise — just colors and dots that tell you when the market mood starts to shift.

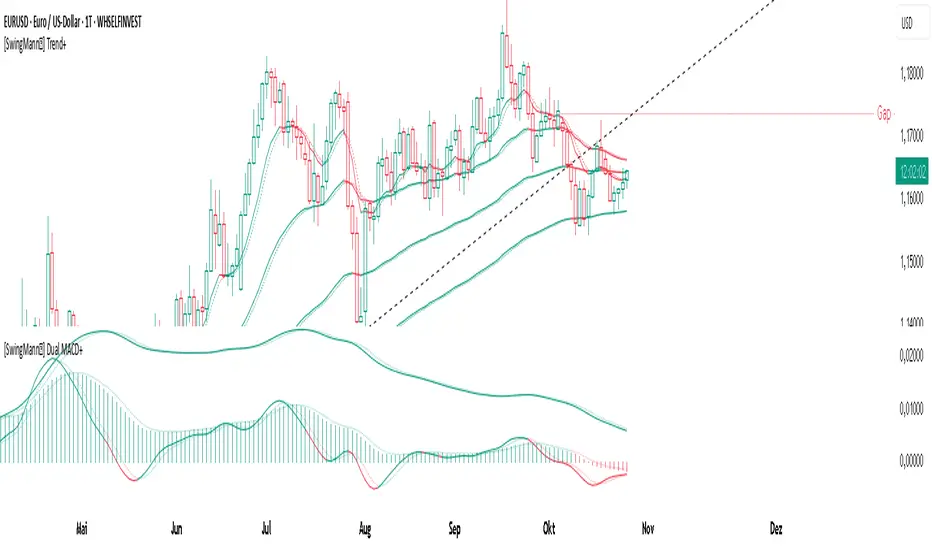
[SwingMann©] Dual MACD+ Dual MACD+
Momentum and Trend Strength Analysis on Two Levels
Description:
The Dual MACD+ combines two distinct MACD configurations to visualize both short-term and medium-term momentum shifts.
By displaying both MACDs side by side, it helps identify phases where momentum and trend direction reinforce or diverge from each other.
The first MACD 1captures short-term swings, while the second MACD 2 provides a smoother view of the broader trend.
Distinct color coding between the two layers allows quick visual recognition of trend strength and directional shifts.
Key Features:
Dual MACD structure for synchronized momentum and trend analysis
Unglättete (raw) MACD calculation — MT4 compatible
Clear color separation for Long and Short phases
Minimalist design focused on clarity and precision
Recommended Use:
Perfect for combination with price action analysis, regression channels, or higher-level swing structures (e.g. EWTrend+ or MACD+).
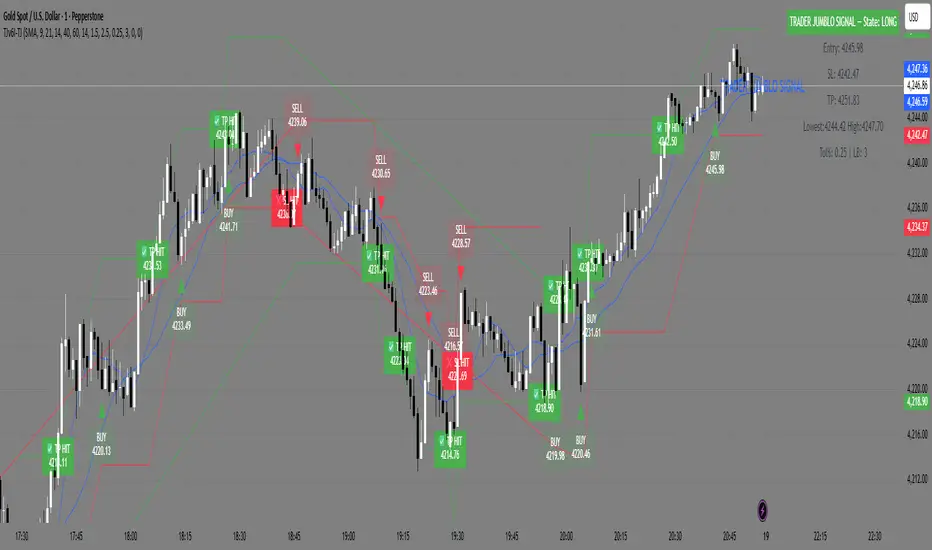
TRADER JUMBLO SIGNAL — Dip & Rally System“Buy from the roots, sell from the peaks.”
A precision-built smart trading system that detects market dips and rallies — allowing you to catch reversals right from the turning points, not halfway through the move.
🧠 How It Works (Concept Overview — no code)
The TRADER JUMBLO SIGNAL system combines trend-following and reversal-detection logic into one tool.
It analyses the last few bars (adjustable Lookback Period) to identify local extremes — the “roots” and “peaks” — and confirms entries using price structure and moving averages.
When conditions align:
-🟢 BUY Signal: Detected near the local lowest low within the lookback period during an uptrend.
-🔴 SELL Signal: Detected near the highest high during a downtrend.
-Each trade automatically sets a dynamic Stop Loss and Take Profit using the ATR (volatility-based).
-Intrabar or close-confirmed entries can be toggled for aggressive or conservative trading styles.
This system ensures you don’t chase candles — instead, it times entries at the core reversal points of the market structure.
⚙️ Key Features
-Dip & Rally Detection: Finds local highs/lows (roots and peaks) within an adjustable lookback window.
-Trend Filter: Only trades in the direction of the dominant moving-average trend.
-Intrabar Mode: Option to allow real-time entries before the candle closes.
-RSI Filter (optional): Filters out weak or overbought/oversold setups.
- ATR-based SL & TP: Automatic volatility-adjusted Stop Loss and Take Profit.
- Smart Table Display: Real-time info panel showing Entry, SL, TP, Lowest, Highest, Tolerance %, and Lookback bars.
-Customizable UI: Enable/disable labels, markers, and SL/TP lines.
Built-in Alerts:
✅ Buy (Dip) Trigger
❌ Sell (Rally) Trigger
🎯 TP Hit
🛑 SL Hit
📊 What Makes It Unique
Unlike basic crossover or RSI systems, this indicator focuses on price reaction around extremes — meaning you enter where reversals start, not after they’ve already moved.
It helps prevent:
Late entries after momentum is gone
Buying tops / selling bottoms
Random entries without market structure context
Instead, you’ll see:
Clean entries from the “roots” (local dips)
Exits or reversals from the “peaks” (local rallies)
Visual feedback for SL/TP hits — so you learn from each setup instantly.
📈 Visuals
🟢 Green markers = BUY entries near local lows.
🔴 Red markers = SELL entries near local highs.
✅ “TP Hit” or ❌ “SL Hit” labels appear on price touch.
🟦 Floating table on chart shows live trade info and state (LONG / SHORT / FLAT).
MACD-V Adaptive FluxProMACD-V Adaptive FluxPro
Type: Multi-Factor Volatility-Normalized Momentum & Regime Framework
Overlay: ✅ Yes (on price chart)
Purpose: Detect high-probability trend continuation or reversal zones through volatility-adjusted momentum, VWAP structure, and adaptive filters.
🧩 Concept Overview
MACD-V Adaptive FluxPro is a next-generation, multi-factor analytical framework that merges the principles of Linda Raschke’s 3-10-16 MACD with modern volatility normalization and adaptive filtering.
Instead of generating raw buy/sell signals, it builds a probability-driven environment model — showing when price action, volatility, and structure align for high-confidence trades.
The “V” in MACD-V stands for Volatility Normalization: every MACD component is divided by ATR to stabilize amplitude across fast or slow markets.
This enables the indicator to remain consistent across timeframes, instruments, and volatility regimes.
⚙️ Core Components
1️⃣ Volatility-Normalized MACD (MACD-V)
A traditional MACD built on Linda Raschke’s 3-10-16 structure, but adjusted by ATR to create a volatility-invariant momentum profile.
You can toggle to alternative presets (Scalp / Swing / Trend) for faster or slower environments.
2️⃣ Dynamic Regime Detection
A slope-based classifier that identifies whether the market is:
Trend Up 🟢
Trend Down 🔴
Compression / Squeeze 🟧
Transition / Neutral ⚫
The background color updates dynamically as momentum, volatility, and slope shift between these states.
3️⃣ VWAP Structure Bands
Adaptive VWAP with inner and outer ATR-scaled envelopes.
These act as short-term mean-reversion and breakout zones.
The indicator can optionally gate entries to occur only within defined VWAP proximity.
4️⃣ EMAs for Micro-Trend Confirmation
Includes 9-EMA and 21-EMA, color-configurable for visual crossovers and short-term momentum bias.
5️⃣ Multi-Timeframe Confirmation Tiles
Top-center dashboard tiles display directional bias from higher timeframes (e.g., 15m / 1h / 4h).
When all align, it confirms multi-frame trend coherence.
6️⃣ Adaptive Probability Engine
All subsystems — MACD-V, slope, compression, volume z-score, and VWAP distance — feed into a logistic scoring model that outputs a real-time AOI Probability (0-100%).
When conditions align, probabilities rise above 60% (long bias) or drop below 40% (short bias).
These are your high-probability “Areas of Interest.”
7️⃣ Dashboard HUD
The top-right status console provides a one-glance view of system state:
Field Meaning
AOI Prob Long Real-time probability of bullish bias
Regime Market state (Trend, Transition, Compression)
Risk Gate ATR-based volatility filter
News Mute Manual toggle for event-risk suppression
ATR (≈ risk) Real-time volatility readout
Status ✅ Trading OK / 🧱 Risk Gate / 🔇 News Mute / 🟧 Compression
🎯 Interpretation Guide
Visual Meaning
🟢 Green background Confirmed uptrend regime
🔴 Red background Confirmed downtrend regime
🟧 Orange background Volatility compression (squeeze forming)
⚫ Gray background Transitional / indecisive structure
Teal % (AOI Prob Long) Bullish probability > 60%
Arrows Optional: appear only when all gates align (rare, filtered signals)
🧮 Mathematical Notes
MACD-V = (EMA_fast(src) − EMA_slow(src)) / ATR(n)
Normalized score is smoothed, scaled 0–100 via logistic curve
Slope = Δ(EMA(src, n)) / ATR(n)
Probabilities gated by:
Minimum slope magnitude (minAbsSlope)
VWAP proximity (maxVWAPDistATR)
Multi-TF agreement
Cooldown interval (cooldownBars)
ATR-based risk gate
No repainting — all calculations use barstate.isconfirmed.
⚡ Use Cases
✅ Identify trend regime changes before major expansions
✅ Filter breakout vs. compression setups
✅ Quantify volatility conditions before entries
✅ Confirm multi-timeframe alignment
✅ Serve as a visual regime map for automated systems or discretionary traders
🧠 Recommended Presets
Market Type Setting Preset Behavior
Index Futures (ES/NQ) LBR 3-10-16 SMA (default) Classic swing/momentum balance
Scalping (1m–5m) Fast Adaptive Higher frequency, shorter cooldown
Swing Trading (1h–4h) Smooth ATR Broader, trend-only signals
Trend-Following Futures Wide ATR Bands Filters noise, favors strong continuation
⚠️ Notes
Non-repainting, bar-confirmed calculations
Signal arrows are optional and rare — intended for precision setups
ATR and slope thresholds should be tuned per instrument
Compatible with all TradingView markets and resolutions
🏁 Summary
“MACD-V Adaptive FluxPro” is not a simple MACD — it’s a volatility-normalized market state engine that adapts to changing conditions.
It fuses Linda Raschke’s timeless MACD logic with modern volatility, slope, and multi-timeframe analytics — giving you a live market dashboard that tells you when not to trade just as clearly as when you should.

[SwingMann©] MACD+ MACD+
Advanced MACD with flexible smoothing and MA types
Description:
The MACD+ is an enhanced version of the classic MACD indicator, designed to give traders greater control over the calculation and smoothing process.
With selectable moving average types (SMA, EMA, WMA) and additional smoothing options for both the MACD and Signal lines, it offers a more refined way to visualize market momentum and trend shifts.
Highlights:
• Choose between SMA, EMA, and WMA for MACD and Signal Line
• Independent smoothing for both MACD and Signal values
• Clean histogram visualization
• Alerts for bullish/bearish histogram phase shifts
• Perfect companion to SwingMann© EWTrend+

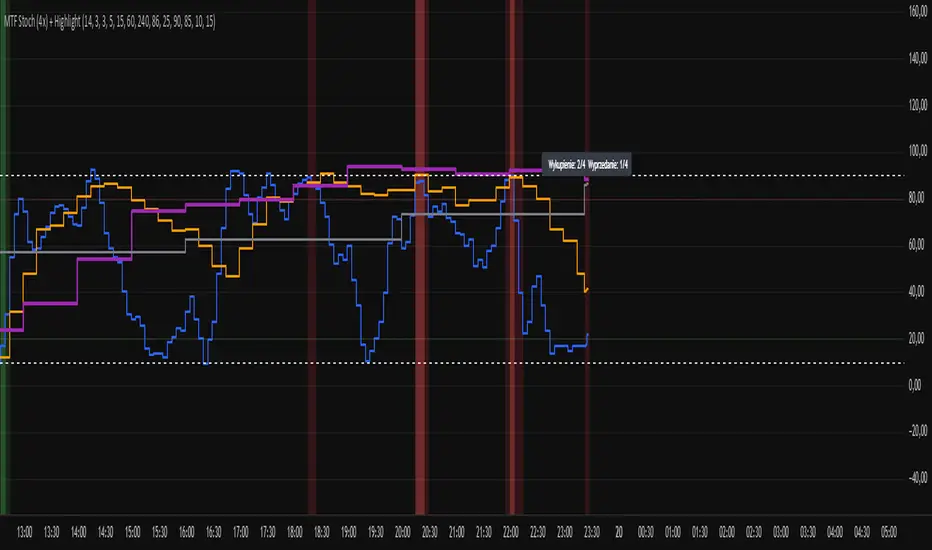
Multi-Timeframe Stochastic (4x Konfiguracja + Schodki)Skrypt stoch z wielu TF można sobie ustawiać pod siebie.

Momentum/Breakout Strategy A professional-grade trend–momentum hybrid strategy designed for high–timeframe precision and long-term consistency.
It combines exponential moving averages (EMA 20/50) to define directional bias, RSI and MACD to confirm momentum strength, and a manually coded ADX filter to validate market trend quality.
ATR-based stop placement and trailing mechanisms control downside volatility, while an optional daily EMA trend filter aligns trades with higher–timeframe direction for smoother performance.

SSI-O - Super Strength Indicator (overlay) [Da_Prof]This is the overlay version of the Super Strength Indicator (SSI). The SSI is a combination of the money flow indicator (MFI), stochastic (Stoch) and relative strength index (RSI). These indicators are averaged together with weightings tested via months of backtesting to produce the SSI algorithm that is not just a simple average or summation of these indicators. The SSI is a sensitive indicator that detects exhaustion of momentum for all assets.
The overlay version of the SSI shows triangles above/below the price when there is high/low risk. The high risk is colored purple. The extreme high risk is colored red. The low risk is colored blue/green and the extreme low risk is colored green.
Weightings of each into the indicator can be changed. If changing the weighting, it is best to ensure the percentages add up to 300%. For example, if changing the RSI weight to 120%, it is best to drop the MFI and Stoch to 90% each.
The RSI SMA is default set at 1. This means the indicator uses the RSI with no smoothing. If changing to greater than 1, then the indicator uses the moving average smoothed RSI.
The default for the Stoch is to use the K only. The D can be used by changing the weightings.

SSI - Super Strength Indicator [Da_Prof]The Super Strength Indicator (SSI) is a combination of the money flow indicator (MFI), stochastic (Stoch) and relative strength index (RSI). These indicators are averaged together with weightings tested via months of backtesting to produce the SSI algorithm that is not just a simple average or summation of these indicators. The SSI is a sensitive indicator that detects exhaustion of momentum for all assets.
The SSI shows background colors when there is high/low risk. The high risk is colored purple. The extreme high risk is colored red. The low risk is colored blue/green and the extreme low risk is colored green.
Weightings of each into the indicator can be changed. If changing the weighting, it is best to ensure the percentages add up to 300%. For example, if changing the RSI weight to 120%, it is best to drop the MFI and Stoch to 90% each.
The RSI SMA is default set at 1. This means the indicator uses the RSI with no smoothing. If changing to greater than 1, then the indicator uses the moving average smoothed RSI.
The default for the Stoch is to use the K only. The D can be used by changing the weightings.

AlphaMACD - Adaptive MACD with Efficiency RatioOVERVIEW
AlphaMACD is an adaptive implementation of the classic MACD indicator that dynamically adjusts its calculation periods based on market efficiency. Unlike traditional MACD which uses fixed periods (typically 12, 26, 9), this indicator adapts its fast and slow EMA periods in real-time based on how efficiently the market is trending.
WHAT MAKES THIS ORIGINAL
This is not a simple MACD with different settings or colors. The core innovation is the adaptive period calculation using Kaufman's Efficiency Ratio, which was originally developed for the Adaptive Moving Average (AMA). This indicator applies that adaptive logic to MACD itself.
Key Differences from Standard MACD:
- Periods dynamically adjust between user-defined ranges (default: 8-21 for fast, 21-55 for slow)
- Uses Kaufman's Efficiency Ratio to measure market trendiness
- Implements gap protection to prevent extreme spikes from market gaps
- Includes market regime detection to filter signals in choppy conditions
- Provides multi-timeframe trend confirmation
HOW IT WORKS
1. Efficiency Ratio Calculation:
The indicator calculates market efficiency by comparing the absolute price change over a period to the sum of absolute price changes within that period. High efficiency = strong trending market. Low efficiency = choppy/sideways market.
2. Adaptive Period Adjustment:
- In trending markets (high efficiency): Periods move toward the minimum values for faster response
- In choppy markets (low efficiency): Periods move toward the maximum values for slower, more stable signals
- The "Sensitivity" parameter controls how aggressively periods adapt (0.5 to 5.0)
3. Gap Protection:
The custom adaptive EMA function detects abnormal price gaps (moves larger than 3x the typical ATR-based change) and limits their impact on the calculation. This prevents weekends or news gaps from causing extreme MACD spikes.
4. Signal Quality Filtering:
- Market regime detection identifies trending vs sideways conditions
- Momentum filter (RSI-based) prevents signals during overextended moves
- Signal strength calculation helps identify high-confidence setups
- Sideways market signals are marked with warning symbols
5. Multi-Timeframe Analysis:
The indicator compares current timeframe MACD with a higher timeframe (default 60 min) to provide context and filter against-trend signals.
HOW TO USE IT
Settings:
- Core Settings: Define the minimum and maximum periods for fast/slow EMAs
- Sensitivity: Higher values make the indicator more responsive to market changes
- Multi-timeframe: Set a higher timeframe for trend confirmation
- Visual options: Customize appearance and enable/disable features
Signal Interpretation:
- Strong bullish/bearish signals (large triangles): High-confidence entries in trending markets
- Warning signals (small ⚠): Crossovers in sideways markets - use caution or skip
- Divergence labels ("DIV"): Price and MACD diverging - potential reversal
- Background color: Green tint = trending market, Orange tint = sideways market
The Information Table shows:
- Current market regime (trending or sideways)
- Market efficiency percentage (how clean the trend is)
- Current adaptive fast and slow periods
- Higher timeframe trend direction
- Current signal strength
Best Practices:
- In trending markets: Trust strong signals, avoid warning signals
- In sideways markets: Reduce position sizes or skip trades entirely
- Use higher timeframe confirmation for better signal quality
- Adjust sensitivity based on your trading timeframe (higher for intraday, lower for swing)
TECHNICAL DETAILS
Calculation Method:
- Efficiency Ratio = ABS(Close - Close ) / SUM(ABS(Close - Close ), Period)
- Smoothed Efficiency = EMA(Efficiency Ratio, 5)
- Fast Period = Fast_Min + (Fast_Max - Fast_Min) × (1 - Smoothed_Efficiency × Sensitivity)
- Slow Period = Slow_Min + (Slow_Max - Slow_Min) × (1 - Smoothed_Efficiency × Sensitivity)
- Adaptive EMA uses standard EMA formula with gap detection and limiting
- MACD = Fast Adaptive EMA - Slow Adaptive EMA
- Signal = EMA(MACD, Signal Period)
- Histogram = MACD - Signal
The adaptive periods are calculated on every bar, so the MACD responds faster in trending conditions and stabilizes during consolidation.
WHAT THIS SOLVES
Standard MACD Problems:
- Fixed periods don't adapt to changing market conditions
- Too many false signals in sideways markets
- Whipsaws during low-volatility consolidation
- Price gaps can cause misleading spikes
AlphaMACD Solutions:
- Periods automatically adjust to market state
- Market regime filter identifies and warns about sideways conditions
- Adaptive smoothing reduces whipsaws
- Gap protection prevents false extremes
LIMITATIONS
- Like all indicators, this does not predict the future
- Requires trending markets for optimal performance
- Adaptive calculation means backtesting results will differ from fixed-period MACD
- More complex than standard MACD - requires understanding of adaptive concepts
- The adaptive periods mean you cannot directly compare this to traditional MACD studies
This indicator is best used as part of a complete trading system, not as a standalone signal generator.
EDUCATIONAL VALUE
For traders learning about:
- Adaptive indicators and market efficiency concepts
- Kaufman's Adaptive Moving Average principles applied to oscillators
- Market regime detection and signal filtering
- Gap handling in technical indicators
- Multi-timeframe analysis integration
Not Financial advice.

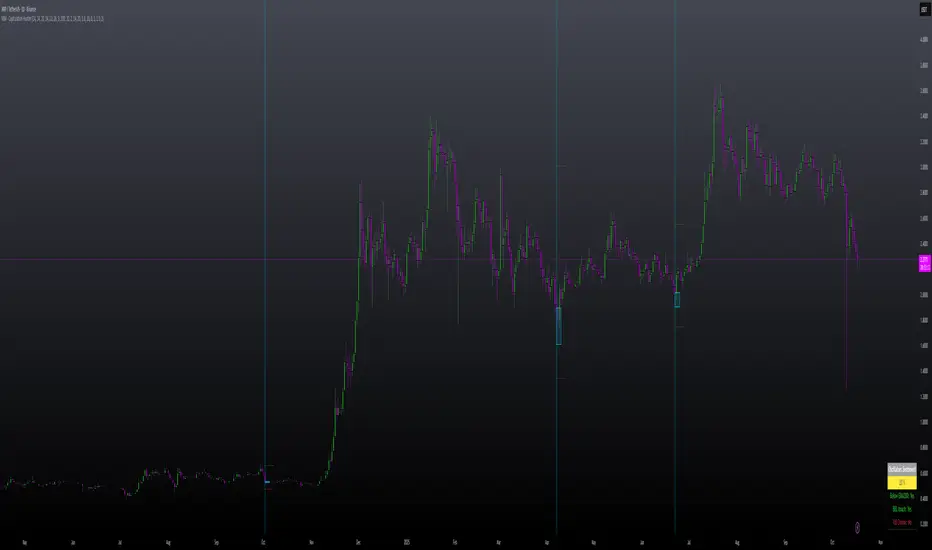
MILLION MEN - Capitulation Hunter What it is
MILLION MEN – Capitulation Hunter detects potential capitulation buy-limits using a confluence of momentum, volatility, and liquidity cues. It combines a 5-oscillator sentiment (RSI / Stoch / CCI / MFI / MACD histogram) with EMA200 trend context, Bollinger lower band proximity, volume climax, and an optional liquidity sweep check. When all filters align, the tool paints a BUY-LIMIT zone and proposes SL/TP levels.
How it works (high-level)
Oscillator sentiment (0–100%): counts how many of the five oscillators are bullish; capitulation candidate = 0%.
Trend & location: price below EMA200 and at/through BB lower band (basis ± mult×σ).
Selling climax: current volume ≥ X × volume SMA.
Liquidity sweep (optional): current low sweeps the prior N-bar low but closes back above it.
Confirmation: optional 0–2 extra bars (close > low and bullish bodies) before validating.
On validation, the script draws: BUY-LIMIT zone, dotted SL = zone bottom − ATR×mult, TP by R:R, and a mini sentiment table.
How to use
Look for zones after fast, extended selloffs into BB-L with volume spike and oscillators at 0%.
Place pending BUY-LIMIT inside the painted zone; use the plotted SL/TP as a starting point.
Works across timeframes; adjust volume multiplier, sweep length, confirmation bars, and ATR×SL to your market.
For added confluence: HTF structure, session/flow, or order-book/liquidity context.
Originality & value
Instead of a generic mashup, this tool enforces a strict confluence: (1) five-oscillator capitulation, (2) location at BB-L under EMA200, (3) volume climax, (4) optional sweep/recapture, and (5) bar-based confirmation—then auto-renders a practical trade plan (zone + SL/TP) and a readable sentiment table. All calculations are manual (no lookahead) and designed for clarity and execution.
Limitations & transparency
Capitulation can persist during strong downtrends; always use structure and risk management.
SL/TP visuals are hints, not orders; adapt to instrument volatility and liquidity.
Non-standard chart types aren’t supported for signals. No future data is used.
This is not financial advice; past performance does not guarantee future results.
(ملخص عربي )
مؤشر يلتقط سيناريوهات الاستسلام البيعي (Capitulation) عبر شروط متشددة: مزاج مؤشرات الزخم = 0%، السعر تحت EMA200 وعند/أسفل BB-L، ذروة فوليوم، واختياري سويب قيعان ثم ارتداد. عند التأكيد يرسم منطقة BUY-LIMIT ويقترح SL/TP. استخدمه مع هيكل السوق وإدارة المخاطر.
CMF, RSI, CCI, MACD, OBV, Fisher, Stoch RSI, ADX (+DI/-DI)Eight normalized indicators are used in conjunction with the CMF, CCI, MACD, and Stoch RSI indicators. You can track buy and sell decisions by tracking swings. The zero line is for reversal tracking at -20, +20, +50, and +80. You can use any of the nine indicators individually or in combination.

TREND (Type II) | Hamster-CoderTREND (Type II) — Smart Trend Reversal Indicator Based on RCI & MACD
TREND (Type II) is a powerful tool for traders who want to spot not just where the market is now, but where it might be heading next.
It combines the analytical strength of RSI and MACD to identify potential trend reversal points before they become obvious on the chart.
🚀 Key Advantages
Early trend detection. TREND can anticipate possible reversals even before the actual crossover occurs.
Flexible visualization. Displayed in a separate panel while showing buy/sell signals directly on the main chart.
Multi-timeframe support. Analyze signals from higher or lower timeframes without switching charts.
Intuitive color background. The background automatically turns red during bearish conditions for instant market sentiment recognition.
🎯 Signal Types
Primary Signal. When RCI and MACD lines actually cross, confirming a trend shift.
Preliminary Signal. When a crossover is projected to occur on the next bar.
Overheat Signal. When the market reaches a defined threshold (e.g. ±90) and starts showing signs of cooling down.
🧠 Unique Features
Extra Filters (experimental). Filters out weak or false signals, showing only those confirmed by additional criteria.
RCI–MACD Difference Mode. Visualize the distance between RCI and MACD as a histogram to assess divergence strength.
Custom Thresholds. Define your own overbought/oversold zones to fine-tune signal sensitivity.
🔍 Who It’s For
TREND (Type II) is ideal for traders who:
seek dynamic entry and exit points without lagging indicators;
want visual and statistical confirmation of trend changes;
build multi-layered strategies requiring signal validation.
💬 Use TREND (Type II) to see the market one step ahead.
This isn’t just another indicator — it’s an early warning system for potential trend reversals .

AlgoWay GRSIM🧭 What this strategy tries to do
This strategy detects when a market move is losing strength and prepares for a potential reversal, but it waits for fresh momentum confirmation before acting.
It combines:
• RSI-based divergence (to spot exhaustion and potential turning points),
• Impulse MACD (to verify that the new direction actually has force behind it).
________________________________________
⚙️ When it takes trades
Long (Buy):
• A bullish RSI divergence appears (a clue that selling pressure is fading);
• Within a short time window, the Impulse MACD turns strongly positive;
• Optionally, the impulse line itself must be rising (if the Impulse Direction Filter is
enabled).
Short (Sell):
• A bearish RSI divergence appears (buying pressure fading);
• Within a short time window, the Impulse MACD turns strongly negative;
• Optionally, the impulse line must be falling (if the Impulse Direction Filter is enabled).
If momentum confirmation happens too late, the divergence “expires” and the signal is ignored.
________________________________________
🧩 How entries work
1. Reversal clue:
The strategy detects disagreement between price and RSI (price makes a new high/low, RSI doesn’t).
That suggests a shift in underlying strength.
2. Momentum confirmation:
Before entering, the Impulse MACD must agree — showing real push in the same direction.
3. Impulse direction filter (optional):
When enabled, the impulse itself must accelerate (rise for longs, fall for shorts), avoiding fake signals where price diverges but momentum is still fading.
4. No stacking:
It opens only one position at a time.
________________________________________
🚪 How exits work
Two main exit styles:
Conservative (default):
Longs close when impulse crosses below its signal line.
Shorts close when impulse crosses above its signal line.
✅ Keeps trades as long as momentum agrees.
Color-change (fast):
Longs close immediately when impulse flips bearish.
Shorts close immediately when impulse flips bullish.
⚡ Faster and more defensive.
Plus:
Stop Loss (%) and Take Profit (%) act as fixed-distance protective exits (set to 0 to disable either one).
________________________________________
📊 What you’ll see on the chart
A thick Impulse MACD line and thin signal line (oscillator view).
Diamonds — detected bullish/bearish divergence points.
Circles — where impulse crosses its signal (momentum change).
A performance panel (top-right) showing Net Profit, Trades, Win Rate, Profit Factor, Pessimistic PF, and Max Drawdown.
________________________________________
🔧 What you can tune
Signal Lifetime (bars): how long a divergence remains valid.
Impulse Direction Filter: ensure the impulse itself is moving in the trade’s direction.
Stop Loss / Take Profit (%): risk and target in percent.
Exit Style: conservative cross or faster color-change.
RSI / MA / Signal Lengths: adjust responsiveness (defaults are balanced).
________________________________________
💪 Strengths
Confirms reversals using momentum direction, not just divergence.
Avoids “early” signals where momentum is still fading.
Works symmetrically for longs and shorts.
Built-in stop/target protection.
Clear, visual confirmation of all logic components.
________________________________________
⚠️ Things to keep in mind
In sideways markets, the impulse can flip often — prefer conservative exits.
Too small SL/TP → constant stop-outs.
Too wide SL/TP → deep drawdowns.
Always test with different timeframes and markets.
________________________________________
💡 Practical tips
Start with default settings.
Enable “Use Impulse Direction Filter” in trending markets, disable it in very choppy ones.
Focus on Profit Factor, Win Rate, and Max Drawdown after several dozen trades.
Keep SL/TP roughly aligned with typical swing size.
“AlgoWay GRSIM” is a reversal-with-confirmation strategy: it spots likely turns, demands real momentum alignment (optionally verified by impulse direction), and manages exits with clear momentum cues plus built-in protective limits.

MomentumMap — Relative Strength Visual Quadrant (RRG-Inspired)🔍 What is MomentumMap?
MomentumMap brings the concept of Relative Rotation Graphs (RRG) directly to your chart.
It helps you instantly see whether a symbol is leading, improving, weakening, or lagging — without scanning dozens of charts.
Unlike traditional RS indicators, this tool plots RS Ratio and RS Momentum together, classifying the current condition into clear quadrants.
🧩 Quadrant Logic
Zone Conditions Market Behavior
🟢 Power Zone RS > 1, Momentum > 0 Strong, leading, expanding trend
🟡 Drift Zone RS > 1, Momentum < 0 Cooling off after leadership
🔵 Lift Zone RS < 1, Momentum > 0 Early signs of strength emerging
🔴 Dead Zone RS < 1, Momentum < 0 Weak and lagging phase
Each bar’s background color reflects the active zone — giving instant visual feedback on rotation strength.
⚙️ Key Features
Benchmark-based RS Ratio & RS Momentum mapping
Auto-classified quadrant display with live background coloring
Optional Power Zone alert (with volume confirmation)
Adjustable RS smoothing and momentum periods
Works on all instruments and timeframes
💡 How to Use
Apply the indicator to any chart.
Choose your benchmark symbol (default: NSE:CNX500).
Observe the color-coded zones to assess strength rotation.
Use transitions between zones to identify:
New leadership → 🟢 Power Zone
Early rotation → 🔵 Lift Zone
Loss of strength → 🟡 Drift Zone
Weak performers → 🔴 Dead Zone
⚠️ Notes & Disclaimer
MomentumMap is an analytical visualization tool, not a buy/sell signal generator.
Choose benchmarks and timeframes that match your trading universe.
The script does not repaint and uses only confirmed bar data.
Past quadrant behavior does not guarantee future results.
Complies with TradingView’s open-source and originality guidelines.
📚 Credits
Concept inspired by Julius de Kempenaer’s RRG framework
Implementation and logic developed independently by Paritosh Gupta

Moving Average Convergence-Divergence (MACD)This script implements the Moving Average Convergence-Divergence (MACD), a popular momentum indicator used in technical analysis to identify trend direction, momentum shifts, and potential buy/sell signals.
🔹 Key Features
1. Inputs & Customization
MACD Lines Toggle: Enable/disable the MACD and signal lines.
Source Price: Defaults to close but can be adjusted (e.g., open, high, low, hl2).
Fast Length (12): The period for the faster-moving EMA.
Slow Length (26): The period for the slower-moving EMA.
Signal Length (9): The smoothing period for the signal line.
2. Calculations
Computes the MACD Line (fast EMA - slow EMA).
Computes the Signal Line (EMA of the MACD line).
Computes the Histogram (difference between MACD and Signal lines).
3. Visual Indicators
Zero Line: A white horizontal line at 0 for reference.
MACD Line: Plotted in green when above the signal line, red when below.
Signal Line: Displayed as a yellow line.
Histogram:
Green bars when MACD > Signal (bullish momentum).
Red bars when MACD < Signal (bearish momentum).
Background Highlights:
Light green on bullish crossovers (MACD crosses above Signal).
Light red on bearish crossunders (MACD crosses below Signal).
4. Alerts
Triggers when:
Bullish Crossover (MACD crosses above Signal).
Bearish Crossunder (MACD crosses below Signal).
🔹 How Traders Use This Indicator
Trend Identification:
MACD above zero → bullish trend.
MACD below zero → bearish trend.
Momentum Signals:
Bullish Crossover (Buy Signal): MACD crosses above Signal.
Bearish Crossunder (Sell Signal): MACD crosses below Signal.
Divergence (Not in this script, but useful):
Price makes higher highs, but MACD makes lower highs → Potential reversal.
🔹 Strengths of This Script
✅ Clean and Efficient Code – Uses Pine Script v6 best practices.
✅ Customizable Inputs – Adjust lengths and source price.
✅ Clear Visuals – Color-coded for easy interpretation.
✅ Built-in Alerts – For automated trading strategies.
Jul 1
Release Notes
This script implements the Moving Average Convergence-Divergence (MACD), a popular momentum indicator used in technical analysis to identify trend direction, momentum shifts, and potential buy/sell signals.
🔹 Key Features
1. Inputs & Customization
MACD Lines Toggle: Enable/disable the MACD and signal lines.
Source Price: Defaults to close but can be adjusted (e.g., open, high, low, hl2).
Fast Length (12): The period for the faster-moving EMA.
Slow Length (26): The period for the slower-moving EMA.
Signal Length (9): The smoothing period for the signal line.
2. Calculations
Computes the MACD Line (fast EMA - slow EMA).
Computes the Signal Line (EMA of the MACD line).
Computes the Histogram (difference between MACD and Signal lines).
3. Visual Indicators
Zero Line: A white horizontal line at 0 for reference.
MACD Line: Plotted in green when above the signal line, red when below.
Signal Line: Displayed as a yellow line.
Histogram:
Green bars when MACD > Signal (bullish momentum).
Red bars when MACD < Signal (bearish momentum).
Background Highlights:
Light green on bullish crossovers (MACD crosses above Signal).
Light red on bearish crossunders (MACD crosses below Signal).
4. Alerts
Triggers when:
Bullish Crossover (MACD crosses above Signal).
Bearish Crossunder (MACD crosses below Signal).
🔹 How Traders Use This Indicator
Trend Identification:
MACD above zero → bullish trend.
MACD below zero → bearish trend.
Momentum Signals:
Bullish Crossover (Buy Signal): MACD crosses above Signal.
Bearish Crossunder (Sell Signal): MACD crosses below Signal.
Divergence (Not in this script, but useful):
Price makes higher highs, but MACD makes lower highs → Potential reversal.
🔹 Strengths of This Script
✅ Clean and Efficient Code – Uses Pine Script v6 best practices.
✅ Customizable Inputs – Adjust lengths and source price.
✅ Clear Visuals – Color-coded for easy interpretation.
✅ Built-in Alerts – For automated trading strategies.

Moving Average Convergence Divergence ProThis script is an advanced and highly customizable version of the classic Moving Average Convergence Divergence (MACD) indicator for TradingView. It builds upon the standard MACD by adding professional features like divergence detection, visual enhancements, configurable alerts, and optional smoothing, making it a more powerful tool for technical analysis.
Key Features and Functionality
Enhanced Visual Customization:
Toggleable Elements: You can independently show or hide the main MACD line, signal line, histogram, and the fill area between the lines.
Customizable Colors: All elements (bullish, bearish, signal line, divergence markers) can be colored to your preference.
Dynamic Histogram: The histogram uses a gradient effect, becoming more transparent during weaker momentum and more opaque during stronger momentum.
Optional EMA Smoothing:
Includes an option to apply an Exponential Moving Average (EMA) to the main MACD line, which can help smooth out noise and provide clearer signals.
Built-in Divergence Detection:
Automatically scans for classic bullish and bearish divergences between price and the MACD line.
Bullish Divergence: Price makes a lower low, but the MACD line makes a higher low (and is above the zero line).
Bearish Divergence: Price makes a higher high, but the MACD line makes a lower high (and is below the zero line).
These are clearly marked with triangle shapes at the top and bottom of the indicator panel.
Comprehensive Alert Conditions:
The script is pre-configured to generate alert conditions for:
Bullish Crossover (MACD line crosses above Signal line)
Bearish Crossunder (MACD line crosses below Signal line)
Bullish Divergence Detection
Bearish Divergence Detection
This allows traders to set up automated notifications directly within TradingView.
Clear Visual Cues:
The entire indicator's background changes color to signal key events:
Green for a bullish crossover.
Red for a bearish crossunder.
Light Green for a bullish divergence.
Light Red for a bearish divergence.
How to Use the Indicator
Signal Generation:
Crossover: The most common signal. A buy signal occurs when the MACD line crosses above the signal line (especially near or below the zero line). A sell signal occurs when it crosses below.
Zero Line: The MACD line crossing above the zero line is considered bullish, and crossing below is bearish.
Divergence: Divergences can be powerful signals for potential trend reversals. A bullish divergence suggests selling pressure may be exhausting, while a bearish divergence suggests buying pressure may be waning.
Customization for Your Strategy:
If you find the standard MACD too noisy, enable the "Show EMA of MACD" option to smooth the main line.
If you only care about crossovers, you can turn off the histogram and fill to reduce visual clutter.
Use the divergence detection to spot high-probability reversal setups that other traders might miss.

SZO - Signal Zone Oscillator ## Signal Zone Oscillator - SZO
**Created by:** @TraderCurses
**Version:** 1.0 (October 2025)
### ▌ OVERVIEW
The Signal Zone Oscillator (SZO) is a comprehensive momentum tool designed to provide a clearer, more nuanced view of market dynamics. It synthesizes three of the most powerful classic indicators—RSI, a unique MACD Ratio, and the Stochastic oscillator—into a single, unified signal.
The indicator's core feature is the **"Signal Zone"**: a colored area between the main oscillator line and its moving average filter. This zone makes it incredibly easy to visualize shifts in momentum, trends, and potential entry/exit points.
### ▌ KEY FEATURES
* **Composite Formula:** Combines RSI, MACD Ratio, and Stochastic using a weighted average to measure underlying market momentum.
* **The Signal Zone:** The flagship feature. The area between the SZO line and its filter is colored **green** in a bullish context (SZO above filter) and **red** in a bearish context (SZO below filter).
* **Dynamic Coloring:** Both the main SZO line and its filter change color dynamically, providing instant feedback on direction and strength.
* **Zero-Line Reference:** A dashed zero line acts as a classic equilibrium level, helping to confirm stronger bullish or bearish momentum.
* **Fully Customizable:** Every parameter is adjustable. You can change the lengths, sources, and even the weights of the core indicators from the settings menu.
* **Built-in Alerts:** Comes with pre-configured alerts for crossovers of the filter and the zero line, allowing you to automate your monitoring.
### ▌ HOW TO USE IT
The SZO provides several clear signals for traders:
1. **Bullish Signal:**
* The SZO line crosses **above** its filter.
* The Signal Zone turns **green**.
* A cross above the zero line can be used as further confirmation of strong bullish momentum.
2. **Bearish Signal:**
* The SZO line crosses **below** its filter.
* The Signal Zone turns **red**.
* A cross below the zero line can be used as further confirmation of strong bearish momentum.
3. **Divergences:**
* Like any oscillator, look for divergences between the SZO's peaks/troughs and the price action to spot potential reversals.
This tool is designed for traders who want to cut through the noise and get a clear, actionable signal from multiple momentum sources at once. Happy trading!
