Fisher Transform on RSIOverview
The Fisher Transform on RSI indicator combines the Relative Strength Index (RSI) with the Fisher Transform to offer a refined tool for identifying market turning points and trends. By applying the Fisher Transform to the RSI, this indicator converts RSI values into a Gaussian normal distribution, enhancing the precision of detecting overbought and oversold conditions. This method provides a clearer and more accurate identification of potential market reversals than the standard RSI.
Key/Unique Features
Fisher Transform Applied to RSI : Transforms RSI values into a Gaussian normal distribution, improving the detection of overbought and oversold conditions.
Smoothing : Applies additional smoothing to the Fisher Transform, reducing noise and providing clearer signals.
Signal Line : Includes a signal line to identify crossover points, indicating potential buy or sell signals.
Custom Alerts : Built-in alert conditions for bullish and bearish crossovers, keeping traders informed of significant market movements.
Visual Enhancements : Background color changes based on crossover conditions, offering immediate visual cues for potential trading opportunities.
How It Works
RSI Calculation : The indicator calculates the Relative Strength Index (RSI) based on the selected source and period length.
Normalization : The RSI values are normalized to fit within a range of -1 to 1, which is essential for the Fisher Transform.
Fisher Transform : The normalized RSI values undergo the Fisher Transform, converting them into a Gaussian normal distribution.
Smoothing : The transformed values are smoothed using a simple moving average to reduce noise and provide more reliable signals.
Signal Line : A signal line, which is a simple moving average of the smoothed Fisher Transform, is plotted to identify crossover points.
Alerts and Visuals : Custom alert conditions are set for bullish and bearish crossovers, and the background color changes to indicate these conditions.
Usage Instructions
Trend Identification : Use the Fisher Transform on RSI to identify overbought and oversold conditions with enhanced precision, aiding in spotting potential trend reversals.
Trade Signals : Monitor the crossovers between the smoothed Fisher Transform and the signal line. A bullish crossover suggests a potential buying opportunity, while a bearish crossover indicates a potential selling opportunity.
Alerts : Set custom alerts based on the built-in conditions to receive notifications when important crossover events occur, ensuring you never miss a trading opportunity.
Visual Cues : Utilize the background color changes to quickly identify bullish (green) and bearish (red) conditions, providing immediate visual feedback on market sentiment.
Complementary Analysis : Combine this indicator with other technical analysis tools and indicators to enhance your overall trading strategy and make more informed decisions.
中心震盪指標

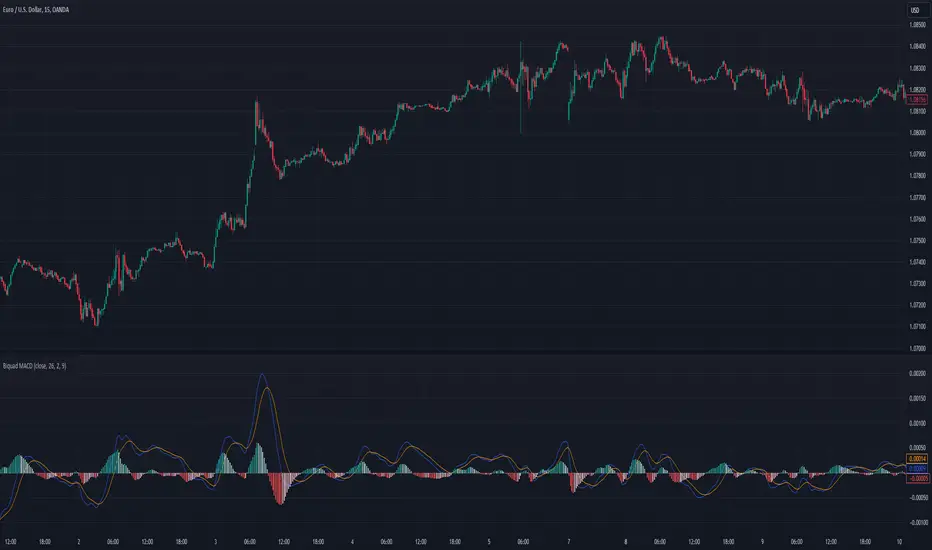
Biquad MACDThis indicator reimagines the traditional MACD by incorporating a biquad band pass filter, offering a refined approach to identifying momentum and trend changes in price data. The standard MACD is essentially a band pass filter, but often it lacks precision. The biquad band pass filter addresses this limitation by providing a more focused frequency range, enhancing the quality of signals.
The MACD Length parameter determines the length of the band pass filter, influencing the frequency range that is isolated. Adjusting this length allows you to focus on different parts of the price movement spectrum.
The Bandwidth (BW) setting controls the width of the frequency band in octaves. It affects the smoothness of the MACD line. A larger bandwidth results in less smooth output, capturing a broader range of frequencies, while a smaller bandwidth focuses on a narrower range, providing a smoother signal.
The Signal Length parameter sets the period for the exponential moving average of the MACD line, which acts as a signal line to identify potential buy and sell points.
Key Features of the Biquad MACD
The MACD is a well-known momentum indicator used to identify changes in the strength, direction, momentum, and duration of a trend in a stock's price. By applying a biquad band pass filter, this version of the MACD provides a more refined and accurate representation of price movements.
The biquad filter offers smooth response and minimal phase distortion, making it ideal for technical analysis. The customizable MACD length and bandwidth allow for flexible adaptation to different trading strategies and market conditions. The signal line smooths the MACD values, providing clear crossover points to indicate potential market entry and exit signals.
The histogram visually represents the difference between the MACD and the signal line, changing colors to indicate rising or falling momentum, which helps in quickly identifying trend changes.
By incorporating the Biquad MACD into your trading toolkit, you can enhance your chart analysis with clearer insights into momentum and trend changes, leading to more informed trading decisions.
Coinbase Premium ($) Absolute Dollar Amount # Coinbase Dollar Premium Indicator
## Description
The Coinbase Dollar Premium Indicator is a powerful tool for cryptocurrency traders and analysts, providing real-time insight into the price differences between major exchanges. This indicator calculates and visualizes the dollar amount premium or discount of Bitcoin on Coinbase compared to the average price on Binance and Kraken.
## Key Features
1. **Dollar Value**: Unlike percentage-based indicators, this tool shows the actual dollar amount difference, giving traders a clear understanding of the magnitude of price disparities.
2. **Multi-Exchange Comparison**: By averaging the prices from Binance and Kraken, the indicator provides a more robust baseline for comparison, reducing the impact of single-exchange anomalies.
3. **Clear Visual Representation**: The indicator uses a color-coded histogram for easy interpretation:
- Green bars indicate a premium on Coinbase (Coinbase price is higher)
- Red bars indicate a discount on Coinbase (Coinbase price is lower)
- The height of each bar represents the dollar amount of the premium or discount
4. **Zero Line Reference**: A horizontal line at zero helps quickly distinguish between premium and discount states.
## Use Cases
- **Arbitrage Opportunities**: Identify potential arbitrage opportunities between exchanges.
- **Market Sentiment**: Gauge institutional and retail investor sentiment, as Coinbase is often associated with US institutional activity.
- **Price Prediction**: Use divergences between exchanges as a potential indicator of short-term price movements.
- **Risk Management**: Understand the pricing landscape across major exchanges to make more informed trading decisions.
This indicator is valuable for both short-term traders looking for quick opportunities and long-term investors wanting to understand market dynamics. By providing a clear, dollar-based view of inter-exchange price differences, the Coinbase Dollar Premium Indicator offers unique insights into the cryptocurrency market's microstructure.
*Note: This indicator is for informational purposes only and should not be considered financial advice. Always conduct your own research and consider your risk tolerance before trading.*

20-day High BreakoutOverview:
The 20-day High Breakout Indicator is a very simple yet powerful tool designed for traders seeking to capitalize on significant price movements in the stock market. This indicator identifies potential buy and sell signals based on a stock's 20-day high breakout levels, making it an essential addition to your trading strategy.
Key Features:
Swing Period Input: Customize the swing period to your preferred number of days, with a default of 20 days, allowing flexibility based on your trading style.
Trailing Stop Level: Automatically calculates the trailing stop level based on the highest high and lowest low within the defined swing period, helping to manage risk and lock in profits.
Buy and Sell Signals: Generates clear buy signals when the price crosses above the trailing stop level and sell signals when the price crosses below, enabling timely entries and exits.
Visual Indicators: Plots buy signals as green upward triangles below the bars and sell signals as red downward triangles above the bars, providing easy-to-interpret visual cues directly on the chart.
How It Works:
Resistance and Support Levels: The indicator calculates the highest high (resistance) and lowest low (support) over the defined swing period.
Swing Direction: It determines the market direction by comparing the current closing price to the previous resistance and support levels.
Trailing Stop Calculation: Depending on the market direction, the trailing stop level is set to either the support or resistance level.
Signal Generation: Buy and sell signals are generated based on the crossover of the closing price and the trailing stop level, filtered to ensure only valid signals are displayed.
Visual Representation: The trailing stop level is plotted as a line, and buy/sell signals are marked with respective shapes for easy identification.
Usage:
Trend Following: Ideal for traders looking to follow trends and catch significant breakouts in the stock price.
Risk Management: Helps in managing risk by providing a trailing stop level that adjusts with market movements.
Visual Clarity: The clear visual signals make it easy for traders to interpret and act upon the indicator's signals.
Add the 20-day High Breakout Indicator to your TradingView charts to enhance your trading strategy and gain an edge in identifying profitable trading opportunities.

Filtered MACD with Backtest [UAlgo]The "Filtered MACD with Backtest " indicator is an advanced trading tool designed for the TradingView platform. It combines the Moving Average Convergence Divergence (MACD) with additional filters such as Moving Average (MA) and Average Directional Index (ADX) to enhance trading signals. This indicator aims to provide more reliable entry and exit points by filtering out noise and confirming trends. Additionally, it includes a comprehensive backtesting module to simulate trading strategies and assess their performance based on historical data. The visual backtest module allows traders to see potential trades directly on the chart, making it easier to evaluate the effectiveness of the strategy.
🔶 Customizable Parameters :
Price Source Selection: Users can choose their preferred price source for calculations, providing flexibility in analysis.
Filter Parameters:
MA Filter: Option to use a Moving Average filter with types such as EMA, SMA, WMA, RMA, and VWMA, and a customizable length.
ADX Filter: Option to use an ADX filter with adjustable length and threshold to determine trend strength.
MACD Parameters: Customizable fast length, slow length, and signal smoothing for the MACD indicator.
Backtest Module:
Entry Type: Supports "Buy and Sell", "Buy", and "Sell" strategies.
Stop Loss Types: Choose from ATR-based, fixed point, or X bar high/low stop loss methods.
Reward to Risk Ratio: Set the desired take profit level relative to the stop loss.
Backtest Visuals: Display entry, stop loss, and take profit levels directly on the chart with
colored backgrounds.
Alerts: Configurable alerts for buy and sell signals.
🔶 Filtered MACD : Understanding How Filters Work with ADX and MA
ADX Filter:
The Average Directional Index (ADX) measures the strength of a trend. The script calculates ADX using the user-defined length and applies a threshold value.
Trading Signals with ADX Filter:
Buy Signal: A regular MACD buy signal (crossover of MACD line above the signal line) is only considered valid if the ADX is above the set threshold. This suggests a stronger uptrend to potentially capitalize on.
Sell Signal: Conversely, a regular MACD sell signal (crossunder of MACD line below the signal line) is only considered valid if the ADX is above the threshold, indicating a stronger downtrend for potential shorting opportunities.
Benefits: The ADX filter helps avoid whipsaws or false signals that might occur during choppy market conditions with weak trends.
MA Filter:
You can choose from various Moving Average (MA) types (EMA, SMA, WMA, RMA, VWMA) for the filter. The script calculates the chosen MA based on the user-defined length.
Trading Signals with MA Filter:
Buy Signal: A regular MACD buy signal is only considered valid if the closing price is above the MA value. This suggests a potential uptrend confirmed by the price action staying above the moving average.
Sell Signal: Conversely, a regular MACD sell signal is only considered valid if the closing price is below the MA value. This suggests a potential downtrend confirmed by the price action staying below the moving average.
Benefits: The MA filter helps identify potential trend continuation opportunities by ensuring the price aligns with the chosen moving average direction.
Combining Filters:
You can choose to use either the ADX filter, the MA filter, or both depending on your strategy preference. Using both filters adds an extra layer of confirmation for your signals.
🔶 Backtesting Module
The backtesting module in this script allows you to visually assess how the filtered MACD strategy would have performed on historical data. Here's a deeper dive into its features:
Backtesting Type: You can choose to backtest for buy signals only, sell signals only, or both. This allows you to analyze the strategy's effectiveness in different market conditions.
Stop-Loss Types: You can define how stop-loss orders are placed:
ATR (Average True Range): This uses a volatility measure (ATR) multiplied by a user-defined factor to set the stop-loss level.
Fixed Point: This allows you to specify a fixed dollar amount or percentage value as the stop-loss.
X bar High/Low: This sets the stop-loss at a certain number of bars (defined by the user) above/below the bar's high (for long positions) or low (for short positions).
Reward-to-Risk Ratio: Define the desired ratio between your potential profit and potential loss on each trade. The backtesting module will calculate take-profit levels based on this ratio and the stop-loss placement.
🔶 Disclaimer:
Use with Caution: This indicator is provided for educational and informational purposes only and should not be considered as financial advice. Users should exercise caution and perform their own analysis before making trading decisions based on the indicator's signals.
Not Financial Advice: The information provided by this indicator does not constitute financial advice, and the creator (UAlgo) shall not be held responsible for any trading losses incurred as a result of using this indicator.
Backtesting Recommended: Traders are encouraged to backtest the indicator thoroughly on historical data before using it in live trading to assess its performance and suitability for their trading strategies.
Risk Management: Trading involves inherent risks, and users should implement proper risk management strategies, including but not limited to stop-loss orders and position sizing, to mitigate potential losses.
No Guarantees: The accuracy and reliability of the indicator's signals cannot be guaranteed, as they are based on historical price data and past performance may not be indicative of future results.

Uptrick: Supply and Demand Zones with RSI, MACD and TP signalsUptrick: Supply and Demand Zones with RSI, MACD Signals and TP Signals
This script is a comprehensive technical analysis indicator for the TradingView platform, combining multiple strategies and indicators to assist traders in making informed decisions. The script incorporates supply and demand zones, Relative Strength Index (RSI), Moving Average Convergence Divergence (MACD) signals, and trend and take profit signals. Below is a detailed explanation of each feature, its purpose, how to use it, and how it differs from other indicators.
Key Features
Supply and Demand Zones:
Purpose: Identify key price levels where buying (demand) or selling (supply) pressure has historically been strong.
Inputs:
supplySwingLength (Default: 20): Determines the number of bars to consider for identifying swing highs for supply zones.
demandSwingLength (Default: 20): Determines the number of bars to consider for identifying swing lows for demand zones.
zoneExtensionBars (Default: 50): Specifies how many bars to extend the zones to the right for visibility.
Usage: The indicator highlights these zones on the chart, making it easier for traders to spot potential reversal points.
Relative Strength Index (RSI) and Moving Average of RSI:
Purpose: RSI measures the speed and change of price movements, helping to identify overbought or oversold conditions. The moving average of RSI smoothens the RSI values to reduce noise.
Inputs:
lengthrsi (Default: 14): The period for calculating RSI.
lengthrsima (Default: 8): The period for calculating the moving average of RSI.
Usage: Buy and sell signals are generated when the RSI crosses above or below the 50 level, respectively, indicating potential entry or exit points.
MACD (Moving Average Convergence Divergence):
Purpose: MACD is a trend-following momentum indicator that shows the relationship between two moving averages of a security’s price.
Inputs:
macdFastLength (Default: 12): The short period for the fast EMA.
macdSlowLength (Default: 26): The long period for the slow EMA.
macdSignalSmoothing (Default: 9): The period for the signal line.
Usage: Buy and sell signals are generated when the MACD line crosses above or below the signal line, respectively. This is an optional feature that can be enabled or disabled.
Signal Type Selection:
Purpose: Allows the trader to choose between RSI signals or supply/demand zone signals.
Inputs:
signalType (Default: "RSI"): Options are "RSI" or "Supply/Demand".
Usage: The chosen signal type determines the logic for plotting buy and sell signals on the chart.
Take Profit Signals:
Purpose: Provide take profit signals based on statistical volatility.
Inputs:
TheLength (Default: 20): The period for calculating the basis SMA and standard deviation.
tpmult (Default: 2.5): The multiplier for the standard deviation to set the take profit levels.
Usage: Generates buy and sell take profit signals when the price crosses over or under the calculated levels.
Detailed Explanation
Supply and Demand Zones Logic:
Swing High and Swing Low:
Functions isSwingHigh and isSwingLow determine whether the current high or low is the highest or lowest within a specified length, indicating potential supply or demand zones.
Zone Visualization:
When a new swing high or low is detected, a box is drawn from the identified bar and extended to the right for visibility. This helps traders visually identify these critical zones.
The boxes are updated dynamically as new swings are detected, ensuring the most relevant zones are always displayed.
RSI and MACD Signals:
RSI Calculation:
The script calculates the RSI using the specified period and then smooths it using an exponential moving average.
Buy and sell signals are generated based on the RSI's crossover with the 50 level.
MACD Calculation:
The MACD line and signal line are calculated using the specified periods.
Buy and sell signals are generated based on crossovers between the MACD line and the signal line.
These signals can be enabled or disabled based on user preference.
Trend Detection and Take Profit Signals:
Trend Detection:
The script calculates the basis (SMA) and upper and lower bands based on the standard deviation.
It determines the trend strength and direction by comparing the current price to these bands.
Take Profit Levels:
Take profit levels are set by multiplying the standard deviation by a user-defined multiplier.
Signals are plotted when the price crosses these take profit levels, indicating potential exit points.
Differences from Other Indicators
Combination of Multiple Indicators:
This script integrates supply and demand zones with RSI and MACD signals, offering a comprehensive tool for technical analysis.
Most other indicators focus on a single strategy, whereas this script provides a holistic view by combining multiple strategies.
Customizable Inputs:
The script offers a high degree of customization, allowing traders to adjust various parameters to suit their trading style and preferences.
Many indicators have fixed settings, limiting their adaptability to different market conditions.
Dynamic Zone Visualization:
The supply and demand zones are dynamically updated, providing real-time insights into key price levels.
This feature is not commonly found in other indicators, which may rely on static levels or less visually intuitive methods.
Usage Guide
Setup:
Add the script to your TradingView chart.
Adjust the input parameters as needed to match your trading strategy.
Interpreting Signals:
Supply and Demand Zones: Look for potential reversal points at these zones.
RSI and MACD Signals: Use these signals to identify potential entry and exit points.
Take Profit Signals: Set take profit levels based on the calculated signals to manage risk and lock in profits.
Combining Signals:
Combine signals from different features to increase the reliability of your trading decisions.
For example, a buy signal from RSI combined with a price approaching a demand zone may indicate a stronger buy opportunity.
Inputs Explained
Supply and Demand Zones:
supplySwingLength: The length of bars to consider for identifying swing highs.
demandSwingLength: The length of bars to consider for identifying swing lows.
zoneExtensionBars: The number of bars to extend the zones to the right.
RSI:
lengthrsi: The period for calculating the RSI.
lengthrsima: The period for calculating the EMA of the RSI.
MACD:
macdFastLength: The short period for the fast EMA.
macdSlowLength: The long period for the slow EMA.
macdSignalSmoothing: The period for the signal line.
Signal Type:
signalType: Choose between "RSI" and "Supply/Demand" signals.
Take Profit:
TheLength: The period for calculating the basis SMA and standard deviation.
tpmult: The multiplier for the standard deviation to set the take profit levels.
Conclusion
The "Uptrick: Supply and Demand Zones with RSI, MACD Signals and TP signals" script is a powerful and versatile indicator that combines multiple strategies to provide traders with a comprehensive analysis tool. Its detailed visualization of supply and demand zones, coupled with RSI and MACD signals, and trend-based take profit signals, makes it an invaluable tool for both novice and experienced traders. By understanding and utilizing its features effectively, traders can make more informed and confident trading decisions.

Flush Percent RangeFans of Woodies CCI may recognize the approach to this one. This is my attempt at using the same methods but for taking the highs and lows into account without the standard deviation of the CCI. The smoothness of other oscillators may not be ideal however the Williams Percent Range is a fast stochastic that also operates within a channel. This provides an alternative yet still complex view for the virtuoso. A unique feature is total utilization of the weighted moving average, from the standard to the more complex. A fun fact is the Hull Moving Average is actually calculated using weighted moving averages.
How to use:
The base length is for accuracy, the fast length is for catching all the moves(even the wrong ones sometimes.)
The bars back option will not flip the histogram/base trend to its bullish/bearish alternative until the base plot remains on the latter half of the oscillator for a certain number of bars. This can be set to zero if desired.
The factor controls the chop on the various levels. A higher number will increase it.
The oscillator levels are measuring slope, price relative to the average, and a summation of percent changes between the two. Both the baseline/histogram and the levels have color coding for bullishness, bearishness, and indecision(depending on the factor.) The fast line matches the indecision color by default. This is all customizable.
There are many potential ways to trade with this indicator. From hooks back toward the trend and range line crossovers to divergence and reversals. It's important to note the current performance of the oscillator levels. Time cycles may come in handy along with other forecasting tools.
Lastly, there are optional linear regression lines plotted on the chart. They're synchronized to the lengths in the oscillator. This is an additional visual aid to provide context to the direction of the channel.
Overall the Flush Percent Range is for analyzing multiple regression models within a single price channel. No smoothing, fast averages, and specified timeframes of highs/lows. Credit to Larry Williams for the original calculation and Ken Woods for design/methodology inspiration.

2 MA Cross Cvg Dvg Slope Overview
This indicator combines the Moving Average Convergence Divergence (MACD) and two Moving Averages (MAs) to assess market momentum and trend direction. It aims to provide insights into the strength and direction of price movements by analyzing the MACD line, MAs slopes, and MA crossovers. Instead of eyeballing the exact MA crossovers and MAs slope steepness on the chart and MACD line changes on separate panes, this indicator pixelate the overloaded information or multiple indicators interpretation into a KISS "boolean" decision making.
Key Components
MACD Line
This line represents the difference between the fast MA and slow MA. It reflects short-term price momentum relative to the long-term trend.
Moving Averages (MAs)
Two types of MAs are utilized in this indicator:
Fast MA (short-term): Often a 9-period MA or similar, which reacts quickly to price changes.
Slow MA (long-term): Typically a 21-period MA or similar, which smooths out price fluctuations and identifies the longer-term trend.
Indicator Logic
MA Crossover: The crossover of the fast MA above the slow MA suggests a bullish trend, while a crossover below indicates a bearish trend.
MA Slope Analysis: The indicator also considers the slopes of both the fast and slow MAs to determine the direction:
Both MA Positive Slope: Indicates upward momentum or bullish trend.
Both MA Negative Slope: Indicates downward momentum or bearish trend.
One MA Positive Slope, the other Negative Slope: Indicates indecision.
MACD Line: MACD Line consecutively increase means increasing positive momentum, vice versa.
Interpretation
Uptrend: When fast MA cross over slow MA. Indicator show "+" symbol at top zone with value 0.5.
Additional Uptrend Confirmation: When both MAs have positive slope. Indicator show only green bar.
Uptrend Upward Momentum: MACD Line increase when fast MA above slow MA. Indicator show "." symbol value 0.75.
Uptrend Downward Momentum: MACD Line decrease when fast MA above slow MA. Indicator show "." symbol value 0.25.
Indecision: When one of the MA has positive slope, but another MA has negative slope. Indicator showing both red and green bar.
Downtrend: When fast MA cross under slow MA. Indicator show "+" symbol at bottom zone with value 0.5.
Additional Downtrend Confirmation: When both MAs have negative slope. Indicator show only red bar.
Downtrend Upward Momentum: MACD Line increase when fast MA below slow MA. Indicator show "." symbol value -0.25.
Uptrend Downward Momentum: MACD Line decrease when fast MA below slow MA. Indicator show "." symbol value -0.75.
Combination of above multiple interpretation can further derive different signal for Trend Starts, Trend Continuous, and Trend Reversals.
Usage
This indicator is valuable for traders seeking to:
Identify entry and exit points based on single or multiple combination of MAs and MACD Line signals.
Confirm trend direction using MAs cross over or cross under spotted easily with the "+" symbol above 0 or below 0.
Double confirm the trend based on two MAs align slope direction.
Understand momentum shifts and potential trend reversals with an easy 4 different dots at -0.75, -0.25, 0.25, and 0.75.
Conclusion
By combining MACD Line analysis with Moving Average slopes and crossovers, this indicator offers a comprehensive approach to assessing market momentum and trend direction. It provides clear signals for traders to make informed decisions on when to enter or exit positions, enhancing overall trading strategy effectiveness without the need of referring to multiple chart or zoom in and out of the price chart to identify the crossover and slope direction.

RSI DeviationAn oscillator which de-trends the Relative Strength Index. Rather, it takes a moving average of RSI and plots it's standard deviation from the MA, similar to a Bollinger %B oscillator. This seams to highlight short term peaks and troughs, Indicating oversold and overbought conditions respectively. It is intended to be used with a Dollar Cost Averaging strategy, but may also be useful for Swing Trading, or Scalping on lower timeframes.
When the line on the oscillator line crosses back into the channel, it signals a trade opportunity.
~ Crossing into the band from the bottom, indicates the end of an oversold condition, signaling a potential reversal. This would be a BUY signal.
~ Crossing into the band from the top, indicates the end of an overbought condition, signaling a potential reversal. This would be a SELL signal.
For ease of use, I've made the oscillator highlight the main chart when Overbought/Oversold conditions are occurring, and place fractals upon reversion to the Band. These repaint as they are calculated at close. The earliest trade would occur upon open of the following day.
I have set the default St. Deviation to be 2, but in my testing I have found 1.5 to be quite reliable. By decreasing the St. Deviation you will increase trade frequency, to a point, at the expense of efficiency.
Cheers
DJSnoWMan06

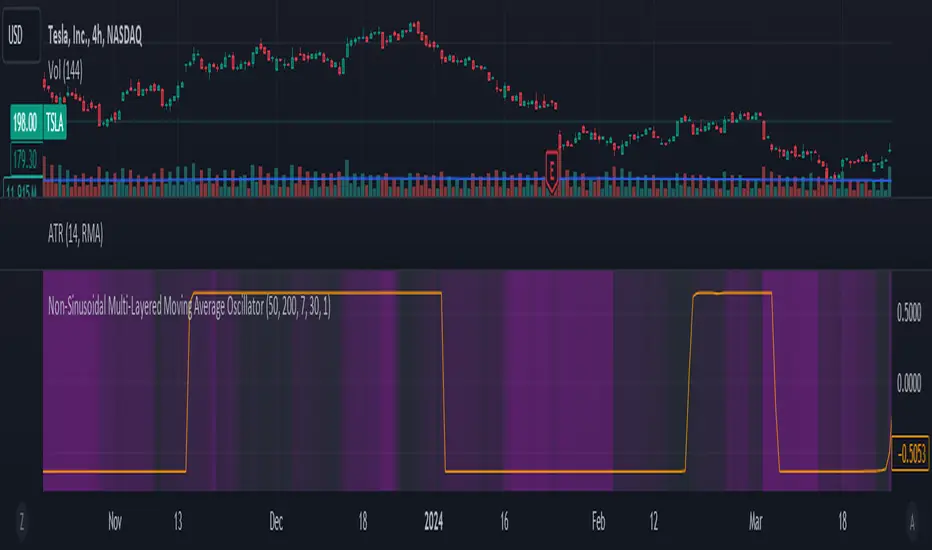
Non-Sinusoidal Multi-Layered Moving Average OscillatorThis indicator utilizes multiple moving averages (MAs) of different lengths their difference and its rate of change to provide a comprehensive view of both short-term and long-term market trends. The output signal is characterized by its non-sinusoidal nature, offering distinct advantages in trend analysis and market forecasting.
Combining the difference between two moving averages with the ROC allows to assess not only the direction and strength of the trend but also the momentum behind it. Transforming these signal in to non-sinusoidal output enhances its utility.
The indicator allows traders to select any one or more of seven moving average options. Larger timeframes (e.g., MA89/MA144) provide a broader identification of the overall trend, helping to understand the general market direction. Smaller timeframes (e.g., MA5/MA8) are more sensitive to price changes and can indicate better entry and exit points, aiding in the identification of retracements and pullbacks. By combining multiple timeframes, traders can get a comprehensive view of the market, enabling more precise and informed trading decisions.
Key Features:
Multiple Moving Averages:
The indicator calculates several exponential moving averages (EMAs) based on different lengths: MA5, MA8, MA13, MA21, MA34, MA55, MA89, and MA144.
These MAs are further smoothed using a secondary exponential moving average, with the smoothing length customizable by the user.
Percentage Differences:
The indicator computes the percentage differences between successive MAs (e.g., (MA5 - MA8) / MA8 * 100). These differences highlight the relative movement of prices over different periods, providing insights into market momentum and trend strength.
Short-term MA differences (e.g., MA5/MA8) are more sensitive to recent price changes, making them useful for detecting quick market movements.
Long-term MA differences (e.g., MA89/MA144) smooth out short-term fluctuations, helping to identify major trends.
Rate of Change (ROC):
The indicator applies the Rate of Change (ROC) to the percentage differences of the MAs. ROC measures the speed at which the percentage differences are changing over time, providing an additional layer of trend analysis.
ROC helps in understanding the acceleration or deceleration of market trends, indicating the strength and potential reversals.
Transformations:
The percentage differences undergo a series of mathematical transformations (either inverse hyperbolic sine transformation or inverse fisher transformation) to refine the signal and enhance its interpretability. These transformations include adjustments to stabilize the values and highlight significant movements.
checkbox allows users to select which mathematical transformations to use.
Non-Sinusoidal Nature:
The output signal of this indicator is non-sinusoidal, characterized by abrupt changes and distinct patterns rather than smooth, wave-like oscillations.
The non-sinusoidal signal provides clearer demarcations of trend changes and is more responsive to sudden market shifts.
This nature reduces the lag typically associated with sinusoidal indicators, allowing for more timely and accurate trading decisions.
Customizable Options:
Users can select which MA pairs to include in the analysis using checkboxes. This flexibility allows the indicator to adapt to different trading strategies, whether focused on short-term movements or long-term trends.
Visual Representation:
The indicator plots the transformed values on a separate panel, making it easy for traders to visualize the trends and potential entry or exit points.
Usage Scenarios:
Short-Term Trading: By focusing on shorter MAs (e.g., MA5/MA8), traders can capture quick market movements and identify short-term trends.
Long-Term Analysis: Utilizing longer MAs (e.g., MA89/MA144) helps in identifying major market trends.
Combination of MAs: The ability to mix different MA lengths provides a balanced view, helping traders make decisions based on both immediate price actions and overall market direction.
Practical Benefits:
Early Signal Detection: The sensitivity of short-term MAs provides early signals for potential trend changes, assisting traders in timely decision-making.
Trend Confirmation: Long-term MAs offer stable trend confirmation, reducing the likelihood of false signals in volatile markets.
Noise Reduction: The mathematical transformations and ROC applied to the percentage differences help in filtering out market noise, focusing on meaningful price movements.
Improved Responsiveness: The non-sinusoidal nature of the signal allows the indicator to react more quickly to market changes, providing more accurate and timely trading signals.
Clearer Trend Demarcations: Non-sinusoidal signals make it easier to identify distinct phases of market trends, aiding in better interpretation and decision-making.
CCI and MACD Auto Trading Strategy with Risk/RewardOverview:
This strategy combines the Commodity Channel Index (CCI) and the Moving Average Convergence Divergence (MACD) indicators to automate trading decisions. It dynamically sets stop-loss and take-profit levels based on recent lows and highs, ensuring a risk/reward ratio of 1:1.5. This script aims to leverage trend and momentum signals while maintaining effective risk management.
Originality and Usefulness:
This script is not just a simple mashup of CCI and MACD indicators; it incorporates dynamic risk management by setting stop-loss and take-profit levels based on recent price action. This approach helps traders to:
・Identify potential trend reversals using the combination of CCI and MACD signals.
・Manage trades effectively by setting realistic stop-loss and take-profit levels based on recent market data.
・Maintain a balanced risk/reward ratio, which is essential for sustainable trading.
Indicators Used:
・CCI (Commodity Channel Index):
・Measures the deviation of the price from its average over a specified period, typically ranging from -100 to +100.
・Helps identify overbought and oversold conditions.
・MACD (Moving Average Convergence Divergence):
・Utilizes the difference between short-term and long-term moving averages to indicate trend strength and direction.
・Provides momentum signals that can be used for timing entries and exits.
How It Works:
Entry Conditions:
Long Entry:
・The MACD histogram is above zero.
・The CCI crosses above the -100 line.
Short Entry:
・The MACD histogram is below zero.
・The CCI crosses below the +100 line.
Exit Conditions:
Long Positions:
・The stop-loss is set at the recent low.
・The take-profit is set at 1.5 times the distance between the entry price and the stop-loss.
Short Positions:
・The stop-loss is set at the recent high.
・The take-profit is set at 1.5 times the distance between the entry price and the stop-loss.
Risk Management:
・The script dynamically adjusts stop-loss and take-profit levels based on recent market data, ensuring that the risk/reward ratio is maintained at 1:1.5.
・This approach helps in managing the risk effectively while aiming for consistent profits.
Strategy Properties:
・Account Size: Configured for a realistic account size suitable for the average trader.
・Commission and Slippage: Includes settings for realistic commission and slippage to reflect real market conditions.
・Risk per Trade: Designed to risk no more than 5-10% of equity per trade, aligning with sustainable trading practices.
・Backtesting Results: Configured to generate a sufficient sample size (ideally more than 100 trades) for reliable backtesting results.
Revised Backtesting Settings
Ensure that your backtesting settings are realistic:
・Account Size: Set a realistic initial capital suitable for the average trader.
・Commission and Slippage: Include realistic commission fees and slippage.
・Risk Management: Ensure that each trade risks no more than 5-10% of the account equity.
・Sufficient Sample Size: Choose a dataset that will generate more than 100 trades to provide a robust sample size.

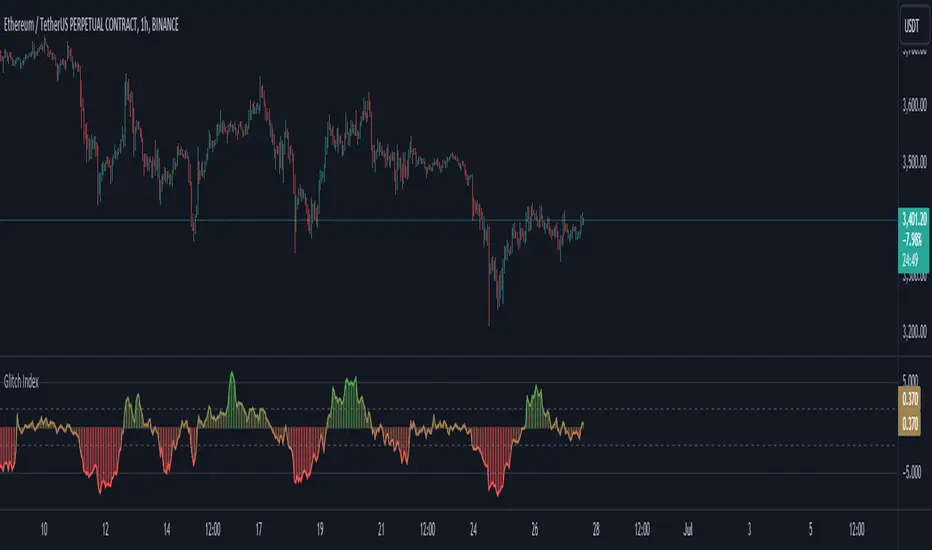
Glitch IndexGlitch Index is an oscillator from an unknown origin that is discovered in 2013 as a lua indicator taken from MetaStock days and we are not really sure how far back the original idea goes.
How it Works?
As I found this indicator and looking at it's code in different platform I can see it comes back from a basic idea of getting a price value, calculating it's smoothed average with a set multiplier and getting the difference then presenting it on a simplified scale. It appears to be another interpretation of figuring out price acceleration and velocity. The main logic is calculated as below:
price = priceSet(priceType)
_ma = getAverageName(price, MaMethod, MaPeriod)
rocma = ((_ma - _ma ) * 0.1) + 1
maMul = _ma * rocma
diff = price - maMul
gli_ind = (diff / price) * -10
How to Use?
Glitch Index can be used based on different implementations and along with your already existing trading system as a confirmation. Yoıu can use it as a Long signal when the histogram crosses inner levels or you can use it as an overbough and oversold signals when the histogram crosses above outter levels and gets back in the range between outter and inner levels.
You can customise the settings and set your prefered inner and outter levels in indicator settings along with gradient or static based coloring and modify the code as you see fit. The coloring code is set below:
gli_col = gli_ind > outterLevel ? color.green : gli_ind < -outterLevel ? color.red : gli_ind > innerLevel ? color.rgb(106, 185, 109, 57) : gli_ind < -innerLevel ? color.rgb(233, 111, 111, 40) : color.new(color.yellow, 60)
gradcol = color.from_gradient(gli_ind, -outterLevel, outterLevel, color.red, color.green)
colorSelect = colorType == "Gradient" ? gradcol : gli_col
KNN OscillatorOverview
The KNN Oscillator is an advanced technical analysis tool designed to help traders identify potential trend reversals and market momentum. Using the K-Nearest Neighbors (KNN) algorithm, this oscillator normalizes KNN values to create a dynamic and responsive indicator. The oscillator line changes color to reflect the market sentiment, providing clear visual cues for trading decisions.
Key Features
Dynamic Color Oscillator: The line changes color based on the oscillator value – green for positive, red for negative, and grey for neutral.
Advanced KNN Algorithm: Utilizes the K-Nearest Neighbors algorithm for precise trend detection.
Normalized Values: Ensures the oscillator values are normalized to align with the stock price range, making it applicable to various assets.
Easy Integration: Can be easily added to any TradingView chart for enhanced analysis.
How It Works
The KNN Oscillator leverages the K-Nearest Neighbors algorithm to calculate the average distance of the nearest neighbors over a specified period. These values are then normalized to match the stock price range, ensuring they are comparable across different assets. The oscillator value is derived by taking the difference between the normalized KNN values and the source price. The line's color changes dynamically to provide an immediate visual indication of the market's state:
Green: Positive values indicate upward momentum.
Red: Negative values indicate downward momentum.
Grey: Neutral values indicate a stable or consolidating market.
Usage Instructions
Trend Reversal Detection: Use the color changes to identify potential trend reversals. A shift from red to green suggests a bullish reversal, while a shift from green to red indicates a bearish reversal.
Momentum Analysis: The oscillator's value and color help gauge market momentum. Strong positive values (green) indicate strong upward momentum, while strong negative values (red) indicate strong downward momentum.
Market Sentiment: The dynamic color changes provide an easy-to-understand visual representation of market sentiment, helping traders make informed decisions quickly.
Confirmation Tool: Use the KNN Oscillator in conjunction with other technical indicators to confirm signals and improve the accuracy of your trades.
Scalability: Applicable to various timeframes and asset classes, making it a versatile tool for all types of traders.

Uptrick: Trend Confirmation IndicatorIf you buy this indicator/strategy the code will be provided so in order to access it you will need to go to Tradingview and at the bottom click 'Pine Editor'. Then click 'Open' and then click on 'New strategy'. Here you can then paste the code and save it. Make sure to first delete all the code that there is before pasting it inside.
Description:
The "Uptrick: Trend Confirmation Indicator" stands as an exceptional tool for traders seeking reliable confirmation of market trends. This indicator integrates multiple technical analysis components to provide clear signals for trend direction, aiding traders in making well-informed trading decisions with confidence.
EMA and MACD Analysis:
The indicator leverages the Exponential Moving Average (EMA) to capture the long-term trend direction of the market. The EMA is calculated over a customizable period, allowing traders to adapt the indicator to various timeframes and market conditions.
Additionally, the Moving Average Convergence Divergence (MACD) is employed to further confirm trend direction. By analyzing the difference between two moving averages and their smoothing, the MACD component helps identify potential shifts in market momentum.
Trend Confirmation Mechanism:
The indicator confirms a trend when the closing price is above the EMA, and the MACD line shows a positive change, indicating upward momentum. This combined signal enhances the reliability of trend confirmation, reducing false signals and noise in the market.
To filter out short-term fluctuations, the indicator requires trend confirmation over multiple bars, ensuring a more robust assessment of market direction.
Background Color and Visualization:
The background color dynamically adjusts based on the direction of the EMA, providing visual cues for trend directionality. A green background signifies an upward trend, while a red background indicates a downward trend.
This visual representation enhances the clarity of trend identification, allowing traders to quickly assess market conditions at a glance.
Signal Generation and Execution:
The indicator generates long signals when the EMA crosses above its previous value, indicating a potential bullish reversal. Conversely, short signals are generated when the EMA crosses below its previous value, signaling a potential bearish reversal.
These signals are executed through automated buy and sell orders, streamlining the trading process and minimizing human error.
Utility and Potential Usage:
The "Uptrick: Trend Confirmation Indicator" is an indispensable tool for traders across various experience levels, offering clear and reliable signals for trend confirmation.
Short-term traders can benefit from its ability to filter out noise and provide accurate trend signals, enhancing their intraday trading strategies.
Long-term investors can leverage its robust trend confirmation mechanism to identify favorable entry and exit points, optimizing their portfolio management and risk mitigation strategies.
In conclusion, the "Uptrick: Trend Confirmation Indicator" stands out as an excellent trading tool, empowering traders with the confidence to navigate the markets effectively and capitalize on profitable opportunities with precision and clarity.

Chande Momentum Oscillator (CMO) Buy Sell Strategy [TradeDots]The "Chande Momentum Oscillator (CMO) Buy Sell Strategy" leverages the CMO indicator to identify short-term buy and sell opportunities.
HOW DOES IT WORK
The standard CMO indicator measures the difference between recent gains and losses, divided by the total price movement over the same period. However, this version of the CMO has some limitations.
The primary disadvantage of the original CMO is its responsiveness to short-term volatility, making the signals less smooth and more erratic, especially in fluctuating markets. This instability can lead to misleading buy or sell signals.
To address this, we integrated the concept from the Moving Average Convergence Divergence (MACD) indicator. By applying a 9-period exponential moving average (EMA) to the CMO line, we obtained a smoothed signal line. This line acts as a filter, identifying confirmed overbought or oversold states, thereby reducing the number of false signals.
Similar to the MACD histogram, we generate columns representing the difference between the CMO and its signal line, reflecting market momentum. We use this momentum indicator as a criterion for entry and exit points. Trades are executed when there's a convergence of CMO and signal lines during an oversold state, and they are closed when the CMO line diverges from the signal line, indicating increased selling pressure.
APPLICATION
Since the 9-period EMA smooths the CMO line, it's less susceptible to extreme price fluctuations. However, this smoothing also makes it more challenging to breach the original +50 and -50 benchmarks.
To increase trading opportunities, we've tightened the boundary ranges. Users can customize the target benchmark lines in the settings to adjust for the volatility of the underlying asset.
The 'cool down period' is essentially the number of bars that await before the next signal generation. This feature is employed to dodge the occurrence of multiple signals in a short period.
DEFAULT SETUP
Commission: 0.01%
Initial Capital: $10,000
Equity per Trade: 80%
Signal Cool Down Period: 5
RISK DISCLAIMER
Trading entails substantial risk, and most day traders incur losses. All content, tools, scripts, articles, and education provided by TradeDots serve purely informational and educational purposes. Past performances are not definitive predictors of future results.

MACD Highlight Zones for PrimetimeUse the MACD Highlight Zones to easily spot changes in market momentum and make more informed trading decisions.
The MACD Highlight Zones script visually enhances your chart by highlighting different zones based on the MACD's relationship to the zero line and its signal line. This script helps traders quickly identify the market's momentum and potential reversal points.
Features:
🟢 Green Background: Indicates the MACD line is above 0, signaling bullish momentum.
🟡 Yellow Background: Indicates the MACD line crosses the signal line, suggesting a potential momentum shift.
🔴 Red Background: Indicates the MACD line is below 0, signaling bearish momentum.
