Trend Vector Pro v2.0Title: Trend Vector Pro v2.0
👨💻 Developed by: Mohammed Bedaiwi
💡 Strategy Overview & Coherence
Trend Vector Pro (TVPro) is a momentum-based trend & reversal strategy that uses a custom smoothed oscillator, an optional ADX filter, and classic Pivot Points to create a single, coherent trading framework.
Instead of stacking random indicators, TVPro is built around these integrated components:
A custom momentum engine (signal generation)
An optional ADX filter (trend quality control)
Daily Pivot Points (context, targets & S/R)
Swing-based “Golden Bar” trailing stops (trade management)
Optional extended bar detection (overextension alerts)
All parts are designed to work together and are documented below to address originality & usefulness requirements.
🔍 Core Components & Justification
1. Custom Momentum Engine (Main Signal Source)
TVPro’s engine is a custom oscillator derived from the bar midpoint ( hl2 ), similar in spirit to the Awesome Oscillator but adapted and fully integrated into the strategy. It measures velocity and acceleration of price, letting the script distinguish between strong impulses, weakening trends, and pure noise.
2. ADX Filter (Trend Strength Validation – Optional)
Uses Average Directional Index (ADX) as a gatekeeper.
Why this matters: This prevents the strategy from firing signals in choppy, non-trending environments (when ADX is below the threshold) and keeps trades focused on periods of clear directional strength.
3. Classic Pivot Points (Context & Targets)
Calculates Daily Pivot Points ( PP, R1-R3, S1-S3 ) via request.security() using prior session data.
Why this matters: Momentum gives the signal, ADX validates the environment, and Pivots add external structure for risk and target planning. This is a designed interaction, not a random mashup.
🧭 Trend State Logic (5-State Bar Coloring)
The strategy uses the momentum's value + slope to define five states, turning the chart into a visual momentum map:
🟢 STRONG BULL (Bright Green): Momentum accelerating UP. → Strong upside impulse.
🌲 WEAK BULL (Dark Green): Momentum decelerating DOWN (while positive). → Pullback/pause zone.
🔴 STRONG BEAR (Bright Red): Momentum accelerating DOWN. → Strong downside impulse.
🍷 WEAK BEAR (Dark Red): Momentum decelerating UP (while negative). → Rally/short-covering zone.
🔵 NEUTRAL / CHOP (Cyan): Momentum is near zero (based on noise threshold). → Consolidation / low volatility.
🎯 Signal Logic Modes
TVPro provides two selectable entry styles, controlled by input:
Reversals Only (Cleaner Mode – Default): Targets trend flips. Entry triggers when the current state is Bullish (or Bearish) and the previous state was not. This reduces noise and over-trading.
All Strong Pulses (Aggressive Mode): Targets acceleration phases. Entry triggers when the bar turns to STRONG BULL or STRONG BEAR after any other state. This mode produces more trades.
📌 Risk Management Tools
Golden Bars – Trailing Stops: Yellow “Trail” Arrows mark confirmed Swing Highs/Lows. These are used as logical trailing stop levels based on market structure.
Extended Bars: Detects when price closes outside a 2-standard-deviation channel, flagging overextension where a pullback is more likely.
Pivot Points: Used as external targets for Take Profit and structural stop placement.
⚙️ Strategy Defaults (Crucial for Publication Compliance)
To keep backtest results realistic and in line with House Rules, TVPro is published with the following fixed default settings:
Order Size: 5% of equity per trade ( default_qty_value = 5 )
Commission: 0.04% per order ( commission_value = 0.04 )
Slippage: 2 ticks ( slippage = 2 )
Initial Capital: 10,000
📘 How to Trade with Trend Vector Pro
Entry: Take Long when a Long signal appears and confirm the bar is Green (Bull state). Short for Red (Bear state).
Stop Loss: Place the initial SL near the latest swing High/Low, or near a relevant Pivot level.
Trade Management: Follow Golden (Trail) Arrows to trail your stop behind structure.
Exits: Exit when: the trailing stop is hit, Price reaches a major Pivot level, or an opposite signal prints.
🛑 Disclaimer
This script is for educational purposes only and does not constitute financial advice. Past performance does not guarantee future results. Always forward-test and use proper risk management before applying any strategy to live trading.
中心震盪指標

Trend Vector Pro v2.0Trend Vector Pro v2.0
👨💻 Developed by: Mohammed Bedaiwi
💡 Strategy Overview & Coherence
Trend Vector Pro (TVPro) is a momentum-based trend & reversal strategy that uses a custom smoothed oscillator, an optional ADX filter, and classic Pivot Points to create a single, coherent trading framework.
Instead of stacking random indicators, TVPro is built around these integrated components:
A custom momentum engine (signal generation)
An optional ADX filter (trend quality control)
Daily Pivot Points (context, targets & S/R)
Swing-based “Golden Bar” trailing stops (trade management)
Optional extended bar detection (overextension alerts)
All parts are designed to work together and are documented below to address originality & usefulness requirements.
🔍 Core Components & Justification
1. Custom Momentum Engine (Main Signal Source)
TVPro’s engine is a custom oscillator derived from the bar midpoint ( hl2 ), similar in spirit to the Awesome Oscillator but adapted and fully integrated into the strategy. It measures velocity and acceleration of price, letting the script distinguish between strong impulses, weakening trends, and pure noise.
2. ADX Filter (Trend Strength Validation – Optional)
Uses Average Directional Index (ADX) as a gatekeeper.
Why this matters: This prevents the strategy from firing signals in choppy, non-trending environments (when ADX is below the threshold) and keeps trades focused on periods of clear directional strength.
3. Classic Pivot Points (Context & Targets)
Calculates Daily Pivot Points ( PP, R1-R3, S1-S3 ) via request.security() using prior session data.
Why this matters: Momentum gives the signal, ADX validates the environment, and Pivots add external structure for risk and target planning. This is a designed interaction, not a random mashup.
🧭 Trend State Logic (5-State Bar Coloring)
The strategy uses the momentum's value + slope to define five states, turning the chart into a visual momentum map:
🟢 STRONG BULL (Bright Green): Momentum accelerating UP. → Strong upside impulse.
🌲 WEAK BULL (Dark Green): Momentum decelerating DOWN (while positive). → Pullback/pause zone.
🔴 STRONG BEAR (Bright Red): Momentum accelerating DOWN. → Strong downside impulse.
🍷 WEAK BEAR (Dark Red): Momentum decelerating UP (while negative). → Rally/short-covering zone.
🔵 NEUTRAL / CHOP (Cyan): Momentum is near zero (based on noise threshold). → Consolidation / low volatility.
🎯 Signal Logic Modes
TVPro provides two selectable entry styles, controlled by input:
Reversals Only (Cleaner Mode – Default): Targets trend flips. Entry triggers when the current state is Bullish (or Bearish) and the previous state was not. This reduces noise and over-trading.
All Strong Pulses (Aggressive Mode): Targets acceleration phases. Entry triggers when the bar turns to STRONG BULL or STRONG BEAR after any other state. This mode produces more trades.
📌 Risk Management Tools
🟡 Golden Bars – Trailing Stops: Yellow “Trail” Arrows mark confirmed Swing Highs/Lows. These are used as logical trailing stop levels based on market structure.
Extended Bars: Detects when price closes outside a 2-standard-deviation channel, flagging overextension where a pullback is more likely.
Pivot Points: Used as external targets for Take Profit and structural stop placement.
⚙️ Strategy Defaults (Crucial for Publication Compliance)
To keep backtest results realistic and in line with House Rules, TVPro is published with the following fixed default settings:
Order Size: 5% of equity per trade ( default_qty_value = 5 )
Commission: 0.04% per order ( commission_value = 0.04 )
Slippage: 2 ticks ( slippage = 2 )
Initial Capital: 10,000
📘 How to Trade with Trend Vector Pro
Entry: Take Long when a Long signal appears and confirm the bar is Green (Bull state). Short for Red (Bear state).
Stop Loss: Place the initial SL near the latest swing High/Low, or near a relevant Pivot level.
Trade Management: Follow Golden (Trail) Arrows to trail your stop behind structure.
Exits: Exit when: the trailing stop is hit, Price reaches a major Pivot level, or an opposite signal prints.
🛑 Disclaimer
This script is for educational purposes only and does not constitute financial advice. Past performance does not guarantee future results. Always forward-test and use proper risk management before applying any strategy to live trading.

Advanced Breakout System v2.0Advanced Breakout System v2.0
Developed by: Mohammed Bedaiwi
This script hunts for high-probability breakouts by combining price consolidation zones, volume spikes vs. average volume, smart money flow (OBV), and a Momentum Override for explosive moves that skip consolidation. Additionally, it automatically identifies and plots Support and Resistance levels with price labels to help you visualize market structure.
The system follows a "Watch & Confirm" logic: it first prints a WATCH setup, then a BUY only if price confirms strength.
💡 JUSTIFICATION OF CONCEPTS (MASHUP & ORIGINALITY)
This script is an original mashup combining several analytical concepts to address common breakout failures:
Volatility Compression Engine: Uses built-in functions like ta.highest() and ta.lowest() to mathematically define the setup phase where price volatility is compressed below a user-defined threshold.
Volume Spike Confirmation: The breakout must be confirmed by a volume increase greater than a moving average of volume, signaling strong market interest.
Smart Volume Filter (OBV): This is the key component. By checking if ta.obv is above its own Moving Average, we confirm that accumulation has been occurring during the consolidation period, suggesting institutional positioning before the price break.
Multi-Exit Risk System: Employs dynamic exits (EMA cross, volume dump, bearish pattern) instead of static stop-losses to manage risk adaptively based on real-time market action.
Market Structure Visualization: The script also includes a Support & Resistance engine to plot key swing pivots and price labels for visual context.
✅ STRATEGY RESULTS & POLICY COMPLIANCE
To ensure non-misleading and transparent backtesting results, this strategy is published with the following fully compliant properties:
Dataset Compliance: The backtest is performed on the CMTL Daily (1D) chart across a long history, generating 201 total trades. This significantly exceeds the minimum requirement of 100 trades, providing a robust test dataset.
Risk Control: The strategy uses a conservative order size set to 2% of equity (default_qty_value=2), strictly adhering to the sustainable risk recommendation of 5-10% of equity per trade.
Transaction Costs: Realistic trading conditions are modeled using 0.07% commission and 3 ticks slippage to prevent the overestimation of profitability.
⚙️ VISUAL GUIDE & SIGNAL LOGIC
Key Color Legend (Visual Guide):
WATCH – Setup (Yellow Arrow Down): Potential breakout setup detected.
BUY – Confirmation (Green Arrow Up): Confirmed breakout, triggered when price trades above the high of the WATCH candle.
SELL – Break (Orange Arrow): Short-term trend weakness, triggered when price closes below the Fast EMA (9).
SELL – Dump (Dark Red Arrow): Distribution / volume dump, triggered by a bearish candle with abnormally high volume.
SELL – Pattern (Purple Arrow): Bearish price-action pattern (such as a bearish engulfing).
Support & Resistance Lines (Red/Green): Small horizontal lines plotted at key swing points with exact price labels.
⌨️ INPUTS (DEFAULT SETTINGS)
Entry settings: Consolidation Lookback (default 20) = bars used to detect consolidation. Consolidation Range % (default 12%) = max allowed range size. Volume Spike Multiplier (default 1.2) = factor above average volume to count as a spike. Force Signal on Big Moves (default ON) = forces a WATCH signal on high-momentum moves.
Exit settings: Enable Fast Exit (EMA 9) toggles the SELL – Break signal. Dump Volume Multiplier defines what counts as “dump” volume.
Support & Resistance: Adjustable Pivot Left/Right bars control the sensitivity of the support and resistance lines.
⚠️ Disclaimer Trading involves significant risk of loss. This script is for educational and informational purposes only and is not financial advice or a recommendation to buy or sell any asset. BUY and SELL signals are rule-based and derived from historical behavior and do not guarantee future performance. Always use your own analysis and risk management. This is an open-source strategy; users are encouraged to test it across different symbols and timeframes.

Kuytrade - Super Scalping Pro V1.0📘 Strategy "Kuytrade - Super Scalping Pro"
What is this strategy?
This is a scalping trading that helps you catch quick profits from short-term price movements. It's perfect for traders who want to make multiple small wins throughout the day.
How does it work?
The strategy uses a 3-level filter system to find high-quality trading signals:
Level 1: CORE Indicators (Must Pass)
- EMA (Moving Averages): Checks if the trend is going up or down
- MACD: Confirms momentum is building in the right direction
Level 2: MOMENTUM Indicators
- RSI: Looks for oversold (ready to bounce up) or overbought (ready to drop) conditions
- Stochastic: Finds reversal points where price might change direction
Level 3: BOOST Indicators
- RSI Divergence: Spots hidden opportunities when price and momentum disagree
- Strong Candles: Identifies powerful price movements
- ATR Filter: Makes sure the market is active enough to trade
Trading Setup
Each Signal Opens 3 Orders:
Order 1: Closes at TP1 (quick small profit)
Order 2: Closes at TP2 (medium profit)
Order 3: Closes at TP3 (big profit target)
Default Settings:
TP1: 1,000 points
TP2: 1,500 points
TP3: 2,500 points
Stop Loss: 1,200 points
Lot Size: 0.01 per order (3 orders total)
Smart Features
- Trailing Stop Loss
- When TP1 hits, the Stop Loss for TP3 automatically moves to breakeven + 150 points, protecting your profit!
- Auto Asset Detection
The strategy automatically recognizes what you're trading:
- Forex pairs (EURUSD, GBPUSD, etc.)
- Gold, Silver, Platinum
- Crypto (Bitcoin, Ethereum)
- Stock Indices (US30, NASDAQ, S&P500)
Indicators:
You can enable/disable each indicator level
Mix and match to find what works for your style
Visuals:
Show/Hide TP/SL lines
Show/Hide entry boxes
Mobile view for smaller screens
When to Use This Strategy?
✅ Best for:
Active markets (London/NY sessions)
Lower timeframes (1m, 5m, 15m)
Volatile pairs with clear trends
❌ Avoid during:
Major news releases
Very quiet markets
Weekends/holidays
----------------------------------------
กลยุทธ์นี้คืออะไร?
Scalping ที่ออกแบบมาให้ช่วยทำกำไรเล็กๆ จากการเคลื่อนไหวของราคาระยะสั้น เหมาะสำหรับเทรดเดอร์ที่ต้องการทำกำไรเล็กน้อยบ่อยๆ ตลอดทั้งวัน
ทำงานยังไง?
กลยุทธ์ใช้ระบบกรองสัญญาณ 3 ระดับ เพื่อหาจุดเข้าที่มีคุณภาพสูง
Level 1: ตัวบ่งชี้หลัก (ต้องผ่าน)
- EMA (เส้นค่าเฉลี่ย): เช็คว่าเทรนด์กำลังขึ้นหรือลง
- MACD: ยืนยันว่าแรงซื้อ/ขายกำลังมาถูกทาง
Level 2: ตัวบ่งชี้โมเมนตัม
- RSI: หาจุด Oversold (ราคาถูกเกินไป พร้อมกลับตัว) หรือ Overbought (ราคาแพงเกิน พร้อมลง)
- Stochastic: หาจุดกลับตัวที่ราคาอาจจะเปลี่ยนทิศ
Level 3: ตัวบ่งชี้เสริม
- RSI Divergence: เจอโอกาสแอบแฝงเมื่อราคาและโมเมนตัมไม่สอดคล้องกัน
- Strong Candles: จับแท่งเทียนที่แรงมาก
- ATR Filter: ตรวจว่าตลาดมีความผันผวนพอจะเทรดไหม
การตั้งค่าการเทรด
แต่ละสัญญาณเปิด 3 ออเดอร์:
ออเดอร์ 1: ปิดที่ TP1 (กำไรเล็กเร็ว)
ออเดอร์ 2: ปิดที่ TP2 (กำไรกลางๆ)
ออเดอร์ 3: ปิดที่ TP3 (กำไรใหญ่)
ค่าเริ่มต้น:
TP1: 800 จุด
TP2: 1,500 จุด
TP3: 2,500 จุด
Stop Loss: 1,200 จุด
ขนาดล็อต: 0.01 ต่อออเดอร์ (รวม 3 ออเดอร์)
ฟีเจอร์พิเศษ
- Trailing Stop Loss (ขยับ SL ตาม)
- เมื่อ TP1 โดน SL ของ TP3 จะเลื่อนมาที่ราคาเข้า + 150 จุด ทำให้คุณไม่ขาดทุน!
- ตรวจจับสินทรัพย์อัตโนมัติ
กลยุทธ์จะจำคู่เงินที่คุณเทรดได้เอง:
คู่เงิน Forex (EURUSD, GBPUSD ฯลฯ)
- ทองคำ, เงิน, แพลตตินั่ม
- คริปโต (Bitcoin, Ethereum)
- ดัชนีหุ้น (US30, NASDAQ, S&P500)
แดชบอร์ดผลงาน (ล่างซ้าย)
- แสดง Win Rate แต่ละ TP
- ติดตามกำไร/ขาดทุนรวม
- แสดงสถิติทั้งหมด
แดชบอร์ดสถานะ Level (บนขวา)
สถานะตัวบ่งชี้แบบเรียลไทม์
เขียว = สัญญาณพร้อม
แดง = รอเงื่อนไข
ตั้งค่าที่ปรับได้
คุณภาพสัญญาณ:
เปิด "Strict Filter" = สัญญาณน้อยแต่คุณภาพสูง
ปิด "Strict Filter" = สัญญาณเยอะแต่อาจเสี่ยงขึ้น
ตัวบ่งชี้:
- เปิด/ปิดแต่ละ Level ได้
- ผสมผสานหาสูตรที่เหมาะกับคุณ
การแสดงผล:
- แสดง/ซ่อนเส้น TP/SL
- แสดง/ซ่อนกล่องข้อมูล Entry
- โหมดมือถือสำหรับจอเล็ก
เมื่อไหร่ควรใช้กลยุทธ์นี้?
✅ เหมาะกับ:
- ตลาดที่คึกคัก (เซสชั่นลอนดอน/นิวยอร์ก)
- ไทม์เฟรมเล็ก (1m, 5m, 15m)
- คู่เงินที่มีความผันผวนและเทรนด์ชัด
❌ หลีกเลี่ยง:
- ช่วงมีข่าวเศรษฐกิจสำคัญ
- ตลาดเงียบมาก
- วันหยุดสุดสัปดาห์

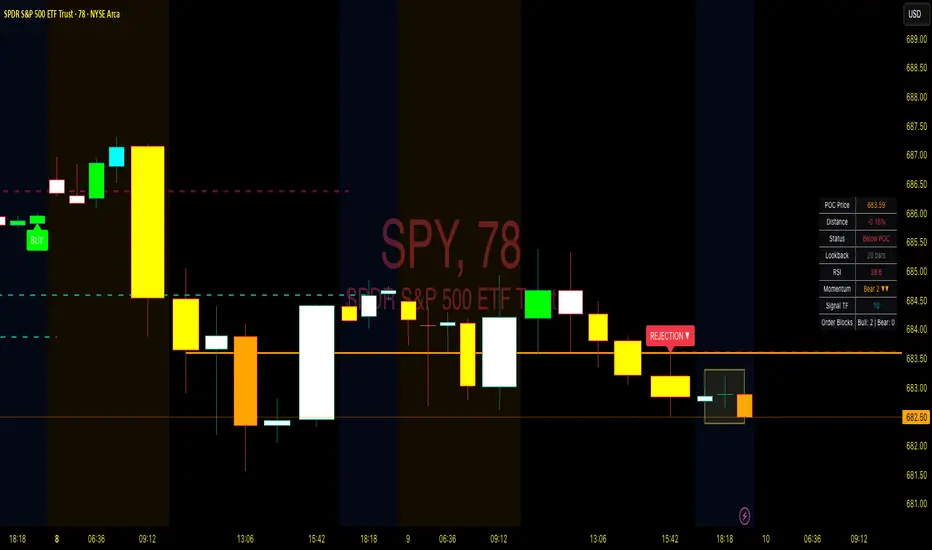
Point of Control + Momentum CandlesPOINT OF CONTROL + MOMENTUM CANDLES
A multi-feature indicator combining volume-based POC detection, 6-level momentum candle coloring, higher timeframe buy/sell signals, and order block identification.
FEATURES
Point of Control (POC)
Calculates the price level with highest traded volume over a customizable lookback period. Includes break and rejection detection with visual signals.
Momentum Candle Coloring
Colors candles based on EMA positioning and RSI values across 6 momentum levels:
- Bull 3/2/1: Strong to weak bullish momentum (Blue/Cyan/Green)
- Bear 1/2/3: Weak to strong bearish momentum (Yellow/Orange/Red)
- Neutral: No clear momentum (White)
Buy/Sell Signals
Generates signals from a user-selectable timeframe using EMA crossovers and RSI conditions. Signals appear on your current chart for multi-timeframe analysis.
Order Blocks
Detects potential institutional entry zones:
- Bullish OB: Last bearish candle before bullish impulse
- Bearish OB: Last bullish candle before bearish impulse
Blocks extend forward and optionally delete when mitigated.
Dashboard
Displays POC price, distance, RSI, momentum level, signal timeframe, and active order block count.
ALERTS
10 conditions available: POC breaks, rejections, buy/sell signals, and order block formations.
HOW TO USE
- Trade POC breaks for trend continuation
- Trade POC rejections for reversals
- Use candle colors to gauge momentum strength
- Confirm entries with higher timeframe signals
- Watch for price returning to order blocks
SETTINGS
All parameters are fully customizable including lookback periods, thresholds, timeframes, colors, and visual styles.
DISCLAIMER
For educational purposes only. Not financial advice. Trading involves risk. Always conduct your own analysis before making trading decisions.
Williams %R + Bollinger %B📊 Williams %R + Bollinger %B Indicator
This indicator blends two complementary oscillators to provide a clearer view of market momentum, volatility, and extreme zones:
🔹 Williams %R (W%R):
Measures the price’s position within its recent range, helping identify overbought/oversold conditions and potential reversal points. It reacts quickly to market shifts, making it useful for spotting short-term exhaustion.
🔹 Bollinger %B (BB%):
Shows where the price sits relative to the Bollinger Bands, highlighting volatility expansions, contractions, and pressure around the bands. It helps confirm breakouts, squeezes, and volatility-driven moves.
🎯 What This Combined Indicator Offers
Dual insight: Momentum (W%R) + volatility (BB%).
Higher precision: Identifies areas where both range extremes and volatility extremes align.
Better timing: Provides clearer entry/exit confirmation based on price behavior relative to range and volatility.
🧠 Suggested Use
Look for confluences, such as W%R showing oversold while BB% signals a lower-band rejection or squeeze.
Spot true breakouts when BB% expands while W%R exits extreme zones.
Filter out noise by analyzing the relationship between both oscillators.

Point of Control + Momentum CandlesPOINT OF CONTROL + MOMENTUM CANDLES
A comprehensive technical analysis indicator combining volume-based Point of Control detection, momentum-graded candle coloring, higher timeframe buy/sell signals, and order block identification.
━━━━━━━━━━━━━━━━━━━━━━━━━━━━━━━━━━━━━━━━━━━━━━━━━━━━━━━━━━━━━━━━━━
WHAT THIS INDICATOR DOES
This indicator identifies key price levels where the most trading activity has occurred (Point of Control), colors candles based on momentum strength, generates buy/sell signals from a user-selected timeframe, and detects order blocks that may act as future support/resistance zones.
━━━━━━━━━━━━━━━━━━━━━━━━━━━━━━━━━━━━━━━━━━━━━━━━━━━━━━━━━━━━━━━━━━
FEATURES
1. POINT OF CONTROL (POC)
The POC represents the price level with the highest traded volume over a lookback period. This indicator calculates a volume profile by distributing volume across price levels and identifying where the most activity occurred.
- Orange horizontal line shows the current POC level
- Yellow box highlights the candles used in the POC calculation
- Break detection identifies when price closes decisively beyond the POC
- Rejection detection identifies when price tests but fails to break the POC
2. MOMENTUM CANDLE COLORING
Candles are colored based on a 6-level momentum system using EMA positioning and RSI values:
Bullish Levels (price above both EMAs):
- Bull Level 3 (Royal Blue): Strong momentum, RSI above 70
- Bull Level 2 (Cyan): Medium momentum, RSI above 60
- Bull Level 1 (Green): Weak momentum, above EMAs
Bearish Levels (price below both EMAs):
- Bear Level 1 (Yellow): Weak momentum, below EMAs
- Bear Level 2 (Orange): Medium momentum, RSI below 40
- Bear Level 3 (Red): Strong momentum, RSI below 30
Neutral (White): No clear directional momentum
3. BUY/SELL SIGNALS
Signals are generated from a user-selectable timeframe (default: 10 minutes) and appear on your current chart. This allows you to see higher timeframe signals while trading on lower timeframes.
Buy Signal Conditions:
- EMA crossover (fast crosses above slow) OR RSI exits oversold
- Bullish candle on the signal timeframe
- Close above both EMAs
Sell Signal Conditions:
- EMA crossunder (fast crosses below slow) OR RSI exits overbought
- Bearish candle on the signal timeframe
- Close below both EMAs
4. ORDER BLOCKS
Order blocks identify potential institutional entry zones that may act as future support or resistance.
- Bullish Order Block (Green zone): The last bearish candle before a bullish impulse move
- Bearish Order Block (Red zone): The last bullish candle before a bearish impulse move
- Blocks automatically extend forward and can be set to delete when mitigated (price closes through the zone)
5. DASHBOARD
A customizable info panel displays:
- Current POC price
- Distance from POC (percentage)
- Position relative to POC (Above/Below/At)
- Lookback period
- Current RSI value
- Current momentum level
- Signal timeframe
- Active order block count
━━━━━━━━━━━━━━━━━━━━━━━━━━━━━━━━━━━━━━━━━━━━━━━━━━━━━━━━━━━━━━━━━━
HOW TO USE
POC Trading:
- Watch for breaks above POC for potential long entries
- Watch for breaks below POC for potential short entries
- Rejections at POC can indicate reversal opportunities
Momentum Reading:
- Use candle colors to gauge trend strength at a glance
- Level 3 colors indicate strong momentum (potential continuation)
- Level 1 colors indicate weakening momentum (potential reversal)
- Neutral/white candles suggest consolidation or indecision
Signal Confirmation:
- Use buy/sell signals from a higher timeframe to confirm entries on your trading timeframe
- Combine signals with POC breaks/rejections for higher probability setups
Order Block Strategy:
- Look for price to return to bullish order blocks for potential long entries
- Look for price to return to bearish order blocks for potential short entries
- Mitigated blocks (price closes through) lose their significance
━━━━━━━━━━━━━━━━━━━━━━━━━━━━━━━━━━━━━━━━━━━━━━━━━━━━━━━━━━━━━━━━━━
SETTINGS OVERVIEW
POC Settings:
- Lookback Period: Number of bars for POC calculation (default: 20)
- Volume Resolution: Price level granularity (default: 50)
- Recalculation Frequency: How often POC updates (default: every 3 bars)
Break/Rejection Detection:
- Break Threshold: Minimum percentage move to confirm a break (default: 0.3%)
- Rejection Wick Ratio: Minimum wick-to-body ratio for rejections (default: 0.5)
Momentum Settings:
- Fast/Slow EMA lengths for trend determination
- RSI length and threshold levels for momentum grading
Buy/Sell Signals:
- Signal Timeframe: The timeframe used for signal calculation
- Separate EMA and RSI parameters for signal generation
Order Blocks:
- Order Block Timeframe: Timeframe for OB detection
- Max Blocks Per Side: Limits displayed order blocks
- Delete Mitigated: Automatically removes invalidated blocks
All visual elements (colors, sizes, line styles) are fully customizable.
━━━━━━━━━━━━━━━━━━━━━━━━━━━━━━━━━━━━━━━━━━━━━━━━━━━━━━━━━━━━━━━━━━
ALERTS
10 alert conditions are available:
- Bullish/Bearish POC Break
- Bullish/Bearish POC Rejection
- Any POC Break
- Any POC Rejection
- Buy Signal
- Sell Signal
- Bullish Order Block Formed
- Bearish Order Block Formed
━━━━━━━━━━━━━━━━━━━━━━━━━━━━━━━━━━━━━━━━━━━━━━━━━━━━━━━━━━━━━━━━━━
NOTES
- The indicator uses request.security() to fetch data from the signal and order block timeframes. This is designed to work when viewing charts at timeframes equal to or lower than your selected signal/OB timeframes.
- POC calculations are based on the visible volume data. Assets with limited volume data may produce less reliable POC levels.
- Order blocks are detected using a simplified algorithm based on candle patterns and displacement. They represent potential zones of interest, not guaranteed support/resistance levels.
━━━━━━━━━━━━━━━━━━━━━━━━━━━━━━━━━━━━━━━━━━━━━━━━━━━━━━━━━━━━━━━━━━
DISCLAIMER
This indicator is provided for educational and informational purposes only. It does not constitute financial advice or a recommendation to buy or sell any security. Trading involves substantial risk of loss. Past performance is not indicative of future results. Always conduct your own analysis and consider your risk tolerance before making trading decisions. Use this tool as part of a comprehensive trading strategy, not as a standalone signal generator.

VWAP Reclaim System_FinaldiTraderVWAP Reclaim System
This script gives you:
VWAP
EMA 9 & EMA 20
Premarket high & low (4:00–9:30am ET)
Optional HOD line
Background highlight when VWAP + EMA trend are bullish (your long zone)
Estrategia Infalible Futuros Supertrend+RSI+EMAS+VWAP (30m) Estrategia para futuros especialmente enfocada en MBT

Smart Divergence Engine [ChartNation]SMART DIVERGENCE ENGINE — REPAINTING-PROOF RSI DIVERGENCE WITH EXHAUSTION CONFIRMATION
═══════════════════════════════════════════
Smart Divergence Engine solves three critical problems that plague free RSI divergence indicators:
PROBLEM 1: REPAINTING DIVERGENCES
Most divergence scripts detect divergence in real-time as bars form. This causes signals to appear, disappear, and reappear unpredictably—making them unusable for alerts or systematic trading.
OUR SOLUTION: Pivot-Locked Detection
Smart Divergence Engine evaluates RSI at the exact bar where price structure confirms (rsi ), not at the current bar. Once a divergence prints, it NEVER disappears. This is implemented via:
Full swing confirmation (Pivot Left + Pivot Right bars must complete)
RSI evaluation at historical bar: rsi , not rsi
Divergence triggers AFTER structure lock, not during formation
Technical implementation: The script stores RSI values at confirmed pivot bars using var floats (lowRsiPrev, lowRsiCurr, highRsiPrev, highRsiCurr), then compares these locked values when new pivots confirm. This prevents any possibility of historical repaint.
PROBLEM 2: FALSE POSITIVE OVERLOAD
Divergence scripts trigger on ANY price-RSI mismatch, flooding charts with weak signals during choppy conditions. No filtering means traders must manually screen out noise.
OUR SOLUTION: Shark Fin Exhaustion Filter
Before any divergence can be considered actionable, Smart Divergence Engine requires RSI to demonstrate genuine momentum exhaustion through our proprietary "Shark Fin" detection:
Shark Fin Logic (Not Found in Free Scripts):
RSI must pierce the outer volatility band by a configurable buffer (default 1.5 RSI points)
RSI must re-enter the band with directional confirmation (positive slope for bullish, negative slope for bearish)
Band width must exceed minimum standard deviation threshold (volatility qualification)
Cooldown period enforced (default 25 bars) to prevent signal clustering
This multi-condition filter dramatically reduces false divergences by requiring RSI to physically demonstrate exhaustion BEFORE structure confirmation matters.
Technical implementation: The Shark Fin state machine uses boolean flags (bullFinForming, bearFinForming) to track when RSI is stretched beyond bands, then validates re-entry using ta.crossover(rsi, lower) / ta.crossunder(rsi, upper) with slope checks (ta.change(rsi) > 0 / < 0) and volatility gates (dev >= finMinDev).
PROBLEM 3: NO VOLATILITY CONTEXT
Divergence scripts use fixed RSI levels (30/70 or similar) that fail to adapt to changing market conditions. What's "overbought" in a low-volatility regime differs drastically from high-volatility conditions.
OUR SOLUTION: Adaptive Volatility Bands
Smart Divergence Engine calculates dynamic overbought/oversold zones using:
34-period SMA of RSI as basis
1.618 standard deviation multiplier (golden ratio expansion)
Real-time band expansion/contraction based on RSI volatility
The bands provide three advantages:
Shark Fin events only qualify when RSI breaches ADAPTIVE thresholds, not arbitrary fixed levels
Band width (standard deviation) serves as volatility filter—narrow bands = low conviction moves get rejected
50-line midline provides regime context (above 50 = bullish bias, below 50 = bearish bias)
Technical implementation: basis = ta.sma(rsi, 34), dev = ta.stdev(rsi, 34), upper/lower = basis ± dev * 1.618. Shark Fin logic requires rsi < (lower - finBuffer) or rsi > (upper + finBuffer) to trigger, ensuring exhaustion is measured relative to CURRENT volatility, not historical constants.
═══════════════════════════════════════════
METHODOLOGY COMPARISON VS FREE ALTERNATIVES
═══════════════════════════════════════════
STANDARD DIVERGENCE SCRIPTS:
Detection timing: Real-time (current bar)
Historical stability: Repaints continuously
Signal filtering: None or minimal
Volatility adaptation: Fixed levels (30/70)
Exhaustion confirmation: Not implemented
Confirmation layers: 1 (divergence only)
Alert reliability: Unreliable (signals disappear)
SMART DIVERGENCE ENGINE:
Detection timing: Pivot-confirmed (rsi )
Historical stability: Locked at structure bar
Signal filtering: Shark Fin + cooldown + stdev gate
Volatility adaptation: Dynamic bands (34-SMA + 1.618σ)
Exhaustion confirmation: Required via Shark Fin
Confirmation layers: 3 (structure + exhaustion + volatility)
Alert reliability: Stable (never repaints)
═══════════════════════════════════════════
TECHNICAL SPECIFICATIONS
═══════════════════════════════════════════
RSI ENGINE:
Base calculation: ta.rsi(src, 14)
Smoothing: ta.rma(rsiRaw, 2) — reduces whipsaw noise
Source: Configurable (default close)
VOLATILITY BANDS:
Basis: 34-period SMA of RSI
Multiplier: 1.618 (golden ratio)
Upper band: basis + (stdev * 1.618)
Lower band: basis - (stdev * 1.618)
Purpose: Creates adaptive overbought/oversold zones
DIVERGENCE DETECTION:
Pivot confirmation: 10 left bars + 10 right bars (default)
RSI evaluation: Locked at rsi (historical bar, never current)
Bullish divergence: price lower low + RSI higher low
Bearish divergence: price higher high + RSI lower high
Rendering: Lines drawn between last two confirmed pivots with labels
SHARK FIN EXHAUSTION FILTER:
Depth buffer: 1.5 RSI points (penetration threshold beyond band)
Min band stdev: 1.0 (volatility qualification)
Cooldown: 25 bars minimum between Shark Fin confirmations
Slope validation: Requires ta.change(rsi) > 0 (bullish) or < 0 (bearish)
State tracking: Boolean flags prevent premature confirmations
VISUAL CUSTOMIZATION:
Beauty Mode: Six-layer gradient fill anchored at 50-line
• Purple regime (above 50) with configurable opacity
• Green regime (below 50) with configurable opacity
• Gradient layers: 33%, 66%, 100% intensity
Divergence lines: Glow effect (6px) + core line (3px), both configurable
Shark Fin rendering: 20% fill between RSI and violated band (ephemeral)
Labels: Compact "Bull"/"Bear" markers with dot indicators
═══════════════════════════════════════════
ALERT SYSTEM
═══════════════════════════════════════════
Four distinct alert conditions (configure once, fires on all intervals):
"RSI Shark Fin — Bullish"
Triggers when: RSI re-enters lower band from below with slope + stdev + cooldown confirmation
Use case: Momentum exhaustion at oversold extreme
Reliability: No repaint (confirmation locked at re-entry bar)
"RSI Shark Fin — Bearish"
Triggers when: RSI re-enters upper band from above with slope + stdev + cooldown confirmation
Use case: Momentum exhaustion at overbought extreme
Reliability: No repaint (confirmation locked at re-entry bar)
"Bullish Divergence (Panel)"
Triggers when: Pivot-confirmed bullish divergence completes (price LL + RSI HL)
Timing: Fires AFTER Pivot Right bars complete (delayed but stable)
Reliability: Never repaints (divergence locked at rsi )
"Bearish Divergence (Panel)"
Triggers when: Pivot-confirmed bearish divergence completes (price HH + RSI LH)
Timing: Fires AFTER Pivot Right bars complete (delayed but stable)
Reliability: Never repaints (divergence locked at rsi )
═══════════════════════════════════════════
TRADING IMPLEMENTATION
═══════════════════════════════════════════
CONFLUENCE FRAMEWORK:
Highest-probability setups occur when three conditions align:
Bullish Setup:
Shark Fin confirms below lower band (exhaustion)
Bullish divergence prints at pivot (structure)
RSI reclaims 50 line (regime shift to bullish)
→ Entry consideration at next price structure (support, swing low)
Bearish Setup:
Shark Fin confirms above upper band (exhaustion)
Bearish divergence prints at pivot (structure)
RSI loses 50 line (regime shift to bearish)
→ Entry consideration at next price structure (resistance, swing high)
TREND CONTEXT:
Strong uptrends: Prioritize bullish divergence + lower band Shark Fins (buy dips)
Strong downtrends: Prioritize bearish divergence + upper band Shark Fins (sell rallies)
Range-bound markets: Use 50-line crossovers as additional confirmation filter
RISK MANAGEMENT:
Smart Divergence Engine provides CONTEXT, not entries:
Wait for price confirmation (engulfing candle, rejection wick, structure break)
Place stops below/above pivot structure that triggered divergence
Size positions based on distance to invalidation level
Divergence + Shark Fin = elevated probability, not certainty
═══════════════════════════════════════════
CONFIGURATION PARAMETERS
═══════════════════════════════════════════
RSI SETTINGS:
RSI Length: 14 (default, standard momentum window)
Price Source: close (configurable to any price source)
Note: 2-period RMA smoothing is hardcoded (reduces noise)
VOLATILITY BAND SETTINGS:
Band Length: 34 (SMA period for RSI basis)
Band Multiplier: 1.618 (golden ratio, adjustable)
Show Bands: Toggle visibility (true/false)
DIVERGENCE SETTINGS:
Pivot Left: 10 bars (left-side swing confirmation)
Pivot Right: 10 bars (right-side swing confirmation)
Overbought Level: 68 (reference line, does not affect logic)
Oversold Level: 32 (reference line, does not affect logic)
SHARK FIN SETTINGS:
Fin Depth Buffer: 1.5 RSI points (penetration threshold)
Min Band Stdev: 1.0 (volatility qualification gate)
Min Bars Between Fins: 25 (cooldown period)
VISUAL SETTINGS (Beauty Mode):
Enable Beauty Mode: true/false (gradient rendering)
Divergence Glow: true/false (glow effect on lines)
Glow Width: 3-10 px (glow layer thickness)
Main Line Width: 1-6 px (divergence core line)
Top Color: Purple (configurable, above-50 regime)
Bottom Color: Green (configurable, below-50 regime)
Top Opacity: 0-100% (gradient base transparency)
Bottom Opacity: 0-100% (gradient base transparency)
═══════════════════════════════════════════
PERFORMANCE & LIMITATIONS
═══════════════════════════════════════════
RESOURCE ALLOCATION:
max_lines_count: 500 (divergence + Shark Fin lines)
max_labels_count: 500 (divergence markers)
max_bars_back: 500 (historical pivot lookback)
Suitable for most timeframes; reduce limits if performance degrades on low-end devices
SIGNAL TIMING:
Divergences print AFTER Pivot Right bars complete. This is intentional:
Delayed signals are more reliable than real-time signals
Structure confirmation requires waiting for swing completion
Users demanding instant signals should use free real-time divergence indicators
Users demanding reliable signals that never disappear should use this
PANEL VS OVERLAY:
This is the panel version (overlay=false):
Renders in separate pane below price chart
RSI, bands, divergence lines, and Shark Fin fills appear in this pane
For price-chart annotations, use the companion overlay version (same logic, different rendering)
═══════════════════════════════════════════
This script implements proprietary methodology not available in regular community scripts:
REPAINTING-PROOF ARCHITECTURE
The pivot-locked detection system (rsi evaluation) is a non-trivial implementation that requires:
State management across bars using var variables
Historical RSI value storage at pivot confirmation
Divergence comparison between stored values (not current bar)
This architecture eliminates the #1 complaint with free divergence indicators: disappearing signals.
SHARK FIN EXHAUSTION LOGIC
The multi-condition state machine that validates momentum exhaustion is not found in free scripts:
Penetration threshold (buffer beyond band)
Directional slope confirmation on re-entry
Volatility gate (minimum standard deviation)
Cooldown enforcement (prevents clustering)
This filter layer was developed through extensive backtesting to reduce false divergences during choppy conditions.
ADAPTIVE VOLATILITY FRAMEWORK
The dynamic band system (34-SMA + 1.618σ) provides context-aware overbought/oversold detection:
Bands expand in volatile markets → signals adapt to conditions
Bands contract in ranging markets → tighter detection thresholds
50-line regime framework → directional bias context
This approach outperforms fixed-level systems (30/70) that ignore market context.
CONFLUENCE METHODOLOGY
The three-layer confirmation system (structure + exhaustion + volatility) was engineered to answer: "When is a divergence actually tradeable?" Free scripts detect divergence and stop there. Smart Divergence Engine asks: "Did RSI show exhaustion? Is volatility sufficient? Did structure confirm?"
This level of methodological depth—combined with repainting-proof architecture and professional-grade visual implementation—justifies closed-source protection and paid access.
═══════════════════════════════════════════
Smart Divergence Engine is engineered for traders who demand institutional-grade divergence detection without the noise, repainting, and false positives that plague free alternatives.
Access is restricted to maintain signal quality as methodology evolves.

Swing Trading IndicatorThis script is a swing‑trading dashboard designed for BTC, ETH, S&P 500 (for now). It combines weekly RSI, USDT.D, VIX, moving averages and Fisher Transform into a single visual tool, with background highlights, an on‑chart info table and ready‑made alerts to help you time high‑probability swing entries and manage risk.
1. Overview
The indicator is intended to work on daily timeframe.
Signals are context‑aware: BTC and ETH get USDT.D conditions, SPX gets VIX and EMA‑100 logic, and all non‑ETH symbols can also use Fisher Transform as a mean‑reversion filter.
2. Conditions and background highlights
Each component sets a boolean condition and, when active, paints a background layer:
Weekly RSI condition
True when weekly RSI is below its symbol‑specific threshold.
USDT.D conditions
BTC: triggered when USDT.D is above the user threshold and the chart symbol is BTC.
ETH: same logic for ETH, but tracked separately..
VIX condition (SPX only)
True when VIX high is at or above the VIX threshold while the chart is SPX.
EMA condition (BTC & SPX)
BTC: daily close below EMA‑200.
SPX: daily close below EMA‑100.
Fisher Transform condition (non‑ETH)
Fisher Transform on the chart timeframe, using the configured period.
True when Fisher value is below the Fisher threshold.
3. Intended use and notes
This indicator is designed as a confluence tool for swing traders, not a standalone buy/sell system. It works best on assets that are in a clear uptrend, where the main idea is to accumulate during corrections within that broader bullish structure.
During larger market shocks, deep corrections, or black‑swan events, trend‑based and mean‑reversion filters can produce false signals, because volatility and correlations often behave abnormally in those periods. For that reason, this script should always be combined with independent risk management, higher‑timeframe trend analysis, and your own discretion.

Pivot Boss IndicatorsPivot boss indicators shows central pivot range and pivot levels for support and resistance.

XAU Micro ScalperThis indicator is designed for short-term price rotation detection on XAUUSD, especially on the 1-minute timeframe.
It combines three momentum components—Stochastic, RSI, and OBV slope—to highlight potential reversal points and short-term scalping opportunities.
Core Logic
The script generates a signal only when multiple conditions align:
1. Stochastic Reversal (Timing Component)
A basic long/short trigger occurs when the Stochastic oscillator exits oversold (long) or overbought (short).
This represents a potential shift in short-term momentum.
2. RSI “Smart Rotation” Filter (Context Component)
Instead of using fixed oversold/overbought thresholds, the indicator checks whether RSI is turning:
Long: RSI is below a contextual ceiling (default 50) and rising
Short: RSI is above a contextual floor (default 55) and falling
This avoids premature entries during strong trending phases and confirms that momentum is actually rotating.
3. OBV Slope Filter (Volume Confirmation)
The On-Balance Volume trend is compared to its previous value:
Long: OBV slope improving
Short: OBV slope deteriorating
This helps confirm whether volume pressure is shifting in favor of the trade direction.
Both RSI and OBV filters can be enabled or disabled independently via the indicator settings.
Signals
Small circles mark raw Stochastic reversal points (unfiltered).
Green / red triangles represent validated long/short signals where all active filters agree.
Optional candle coloring highlights confirmed entry signals on the chart.
Use Cases
Intraday and scalping strategies on XAUUSD
Identifying short-term momentum reversals
Filtering noisy signals during high-volatility sessions
Studying how volume and momentum align around turning points
Customization
Users can adjust:
RSI contextual thresholds
Lookback periods
OBV slope sensitivity
Stochastic parameters
Activation of RSI and OBV filters
This flexibility allows the indicator to adapt to different market conditions and timeframes.
Disclaimer
This indicator does not provide financial advice or guarantee performance.
Always test any strategy on historical data and use proper risk management.

KSL-Fullsystem V2.0Trend Following & Reversal Trading System. It combines **Price Action (Market Structure)** with multiple technical indicators to generate high-quality Buy and Sell signals.
---
1. How Signals are Generated (The Core Logic)
The script uses **"Internal Shifts"** (Market Structure Breaks) to find entry points.
* BUY Signal: The price breaks above a previous bearish structure (Higher High) + All enabled filters are Green.
* SELL Signal: The price breaks below a previous bullish structure (Lower Low) + All enabled filters are Red.
When a signal occurs, the script automatically calculates:
* Stop Loss (SL): Based on the recent Swing High/Low.
* Take Profit (TP): Three levels (TP1, TP2, TP3) based on risk-reward ratios (1.5x, 2.0x, 3.0x).
---
2. The Filters (Your Confirmation Checklist)
You can turn these On/Off in the settings. **Note:** If you turn *all* of them on, you might get very few signals because the conditions become too strict.
**A. Bollinger Bands (BB) Filters (Primary Feature)**
This is the main filter for this version.
* Squeeze Filter: Prevents trading when the bands are too narrow (low volatility). If the background turns **Yellow**, it means the market is "Squeezing" – **Do Not Trade.**
* Touch Entry: Looks for price bouncing off the Lower Band (Buy) or Upper Band (Sell).
* Breakout Entry: Looks for price blasting through the bands.
* Mean Reversion: Checks if price is reverting to the middle line (Basis).
**B. Moving Average Filters (Trend)**
The script includes three types of Moving Averages. You can choose which style suits you:
* EMA (Exponential): Fast-reacting. Good for scalping.
* SMA (Simple): Standard trend lines. Good for position trading.
* LWMA (Linear Weighted): Focuses heavily on recent data.
* Configuration: You can select specific setups like "Scalping" (9/21/50 EMA) or "Trend" (50/200 EMA).
**C. Momentum Filters**
* MACD: Checks momentum. You can choose settings for Scalping, Day Trading, or Swing Trading.
* AO (Awesome Oscillator) & AC: Helps confirm if the momentum is strong enough to support the trend.
---
**3. Visual Guide: What You See on the Chart**
* Green Box: A Buy Zone (Demand).
* Red Box: A Sell Zone (Supply).
* Labels (Text): Shows "BUY" or "SELL" with exact prices for TP1, TP2, TP3, and SL.
* Blue Lines: The Bollinger Bands (Upper and Lower).
* Orange Line: The Bollinger Band Basis (Middle).
* Small Triangles:
* Green Triangle (Below Bar): Price touched the Lower Bollinger Band.
* Red Triangle (Above Bar): Price touched the Upper Bollinger Band.
* Yellow Background: **WARNING.** The market has low volume/volatility (BB Squeeze). Wait for a breakout.
---
4. How to Use This Script
1. Select Your Style: Go to the Settings (Inputs).
* If you are a **Scalper**, turn on "Scalping EMA" or "Scalping MACD".
* If you are a **Swing Trader**, turn on "Swing SMA" or "Trend EMA".
2. Configure Bollinger Bands: Keep `Use Bollinger Bands Filter` checked. Decide if you want to trade "Squeezes" (usually safer to avoid them).
3. Wait for the Label: Do not enter blindly. Wait for the script to print a **BUY** or **SELL** label with the TP/SL targets.
4. Check the Background: If the background is **Yellow**, ignore the signal or wait until the color clears.
5. Manage Risk: Place your Stop Loss at the price shown on the label ("SL").

VWAP-Anchored MACD [BOSWaves]VWAP-Anchored MACD - Volume-Weighted Momentum Mapping With Zero-Line Filtering
Overview
The VWAP-Anchored MACD delivers a refined momentum model built on volume-weighted price rather than raw closes, giving you a more grounded view of trend strength during sessions, weeks, or months.
Instead of tracking two EMAs of price like a standard MACD, this tool reconstructs the MACD engine using anchored VWAP as the core input. The result is a momentum structure that reacts to real liquidity flow, filters out weak crossovers near the zero line, and visualizes acceleration shifts with clear, high-contrast gradients.
This indicator acts as a precise momentum map that adapts in real time. You see how weighted price is accelerating, where valid crossovers form, and when trend conviction is strong enough to justify execution.
It uses gradient line coloring to show bullish or bearish momentum, histogram shading to highlight energy shifts, cross dots to mark valid crossovers, optional buy/sell diamonds for execution cues, and candle coloring to display trend strength at a glance.
Theoretical Foundation
Traditional MACD compares the difference between two exponential moving averages of price.
This variant replaces price with anchored VWAP, making the calculation sensitive to actual traded volume across your chosen period (Session, Week, or Month).
Three principles drive the logic:
Anchored VWAP Momentum : Price is weighted by volume and aggregated across the selected anchor. The fast and slow VWAP-EMAs then expose how liquidity-corrected momentum is expanding or contracting.
Zero-Line Distance Filtering : Crossover signals that occur too close to the zero line are removed. This eliminates the common MACD problem of generating weak, directionless signals in choppy phases.
Directional Visualization : MACD line, signal line, histogram, candle colors, and optional diamond markers all react to shifts in VWAP-momentum, giving you a clean structural read on market pressure.
Anchoring VWAP to session, weekly, or monthly resets creates a systematic framework for tracking how capital flow is driving momentum throughout each trading cycle.
How It Works
The core engine processes momentum through several mapped layers:
VWAP Aggregation : Price × volume is accumulated until the anchor resets. This creates a continuous, liquidity-corrected VWAP curve.
MACD Construction : Fast and slow VWAP-EMAs define the MACD line, while a smoothed signal line identifies edges where momentum shifts.
Zero-Line Distance Filter : MACD and signal must both exceed a threshold distance from zero for a crossover to count as valid. This prevents fake crossovers during compression.
Visual Momentum Layers : It uses gradient line coloring to show bullish or bearish momentum, histogram shading to highlight energy shifts, cross dots to mark valid crossovers, optional buy/sell diamonds for execution cues, and candle coloring to display trend strength at a glance.
This layered structure ensures you always know whether momentum is strengthening, fading, or transitioning.
Interpretation
You get a clean, structural understanding of VWAP-based momentum:
Bullish Phases : MACD > Signal, histogram expands, candles turn bullish, and crossovers occur above the threshold.
Bearish Phases : MACD < Signal, histogram drives lower, candles shift bearish, and downward crossovers trigger below the threshold.
Neutral/Compression : Both lines remain near the zero boundary, histogram flattens, and signals are suppressed to avoid noise.
This creates a more disciplined version of MACD momentum reading - less noise, more conviction, and better alignment with liquidity.
Strategy Integration
Trend Continuation : Use VWAP-MACD crossovers that occur far from the zero line as higher-conviction entries.
Zero-Line Rejection : Watch for histogram contractions near zero to anticipate flattening momentum and potential reversal setups.
Session/Week/Month Anchors : Session anchor works best for intraday flows. Weekly or monthly anchor structures create cleaner macro momentum reads for swing trading.
Signal-Only Execution : Optional buy/sell diamonds give you direct points to trigger trades without overanalyzing the chart.
This indicator slots cleanly into any momentum-following system and offers higher signal quality than classic MACD variants due to the volume-weighted core.
Technical Implementation Details
VWAP Reset Logic : Session (D), Week (W), or Month (M)
Dynamic Fast/Slow VWAP EMAs : Fully configurable lengths, smoothing and anchor settings
MACD/Signal Line Framework : Traditional structure with volume-anchored input
Zero-Line Filtering : Adjustable threshold for structural confirmation
Dual Visualization Layers : MACD body + histogram + crosses + candle coloring
Optimized Performance : Lightweight, fast rendering across all timeframes
Optimal Application Parameters
Timeframes:
1- 15 min : Short-term momentum scalping and rapid trend shifts
30- 240 min : Balanced momentum mapping with clear structural filtering
Daily : Macro VWAP regime identification
Suggested Configuration:
Fast Length : 12
Slow Length : 26
Signal Length : 9
Zero Threshold : 200 - 500 depending on asset range
These suggested parameters should be used as a baseline; their effectiveness depends on the asset volatility, liquidity, and preferred entry frequency, so fine-tuning is expected for optimal performance.
Performance Characteristics
High Effectiveness:
Assets with strong intraday or session-based volume cycles
Markets where volume-weighted momentum leads price swings
Trend environments with strong acceleration
Reduced Effectiveness:
Ultra-choppy markets hugging the VWAP axis
Sessions with abnormally low volume
Ranges where MACD naturally compresses
Disclaimer
The VWAP-Anchored MACD is a structural momentum tool designed to enhance directional clarity - not a guaranteed predictor. Performance depends on market regime, volatility, and disciplined execution. Use it alongside broader trend, volume, and structural analysis for optimal results.

Affirmify AI — Entry PrecisionAffirmify AI — Entry Precision is a multi-factor directional model with entry-quality filter and ATR-based SL/TP, synced with the Affirmify core engine.
What is Affirmify AI — Entry Precision?
Affirmify AI — Entry Precision is the TradingView front-end of the Affirmify core model.
It combines:
multi-timeframe trend filters
momentum & volatility conditions
an entry-quality check (candle body vs ATR)
ATR-based SL/TP engine
The script is designed to mirror the logic of the Affirmify Python backend used on AffirmifyHub.com.
Core idea
1.Score (core direction):
Built from ADX, EMA trend, RSI zone, MACD histogram, DI+/DI- and ATR volatility penalty.
Score ≥ +2 → BUY bias
Score ≤ −2 → SELL bias
Between −1 and +1 → no clear direction.
2.Higher-timeframe (MTF) confirmation:
Same style of scoring on a higher TF (default 4H).
If MTF direction conflicts with the main timeframe, the script will show “MTF conflict / NO TRADE” and block signals.
3.Entry quality filter:
Checks if the candle body is large enough vs ATR (Min body size (x ATR)).
Output:
CONFIRMED – direction + volatility + body are aligned
WAIT FOR BETTER ENTRY – direction ok, but body is too small
NO QUALITY ENTRY – conditions are not met.
4.ATR-based SL/TP engine:
Internal engine (uses ATR × multiplier or minimal tick distance).
Values are shown on the panel only (no lines drawn on chart), so the chart stays clean.
Panel overview
The panel in the top-right shows:
Action – BUY / SELL / NO TRADE
Status – CONFIRMED / WAIT FOR BETTER ENTRY / NO SIGNAL / MTF conflict
Entry – last confirmed entry price
SL / TP – suggested ATR-based stop-loss and take-profit
Higher TF – higher timeframe filter state (ON/OFF and TF used)
Score – core multi-factor score on the current timeframe
Vol – “Normal volatility” or “Low volatility (ATR penalized)”
Inputs – quick guide
Trend & Filters
EMA Fast / Mid / Slow – EMAs used for trend & bias detection
ADX Length – period for ADX (trend strength)
RSI Length – period for RSI zone filter
ATR Length – ATR used for volatility & body/SL/TP logic
Low ATR threshold (% of price) – defines when the market is considered “low volatility”.
Higher timeframe confirmation
Use higher timeframe filter – enable / disable MTF confirmation
Higher TF – e.g. 240 (4H), 60 (1H), etc.
Entry Precision
Min body size (x ATR) – minimum body vs ATR required for a CONFIRMED entry.
SL / TP
Min SL = ATR x – minimal ATR distance for SL
Min TP = ATR x – minimal ATR distance for TP
Min SL in ticks / Min TP in ticks – hard floor, based on instrument tick size.
Visuals
Show info panel – show / hide the top-right dashboard
Show status badges – textual badges above the last candle
Draw ENTRY/SL/TP (panel only, legacy) – kept for compatibility; does not draw lines in this version.
Alerts
The script provides three alert conditions:
Affirmify: BUY confirmed
Triggered when BUY direction is aligned and entry quality is CONFIRMED (no MTF conflict).
Affirmify: SELL confirmed
Triggered when SELL direction is aligned and entry quality is CONFIRMED (no MTF conflict).
Affirmify: wait for better entry
Direction is valid, but candle body is not yet strong enough – potential setup forming.
You can connect these alerts to your own automation, bots or dashboards.
How to use it (typical workflow)
Select your symbol and timeframe (most users focus on 1H / 4H).
Wait for the panel to show a clear Action (BUY or SELL) with a solid Score (≥ +2 or ≤ −2).
Look for Status = CONFIRMED for actual entries.
Use the panel SL / TP values as a starting point for your own risk management.
Avoid trades when:
Status shows “NO SIGNAL” or “NO CLEAR DIRECTION”
MTF conflict is active
Volatility is extremely low for your style.
Access & subscription
This is an invite-only script connected to the AffirmifyHub ecosystem.
Access is managed via private subscription on AffirmifyHub.com.
After activation you will receive TradingView access to this indicator from the author account.
For questions about access, licensing or private use, please contact the author via TradingView DM or through AffirmifyHub.
Important notice
This tool does not guarantee profits and should never be used as a standalone decision engine.
Always combine it with:
your own price action reading
multi-timeframe context
strict position sizing and risk management.
Markets are risky – never trade money you cannot afford to lose.Multi-factor directional model with entry-quality filter and ATR-based SL/TP levels, synced with the Affirmify core Python engine.

Relative Value & Risk Analytics DashboardThis is your risk-adjusted alpha analysis tool - exactly what hedge fund and insurance company clients want to see.
Attractiveness Score | Composite score combining RV and Risk (0-100)
Relative Performance | vs Benchmark (SET/SPY), RS Ratio Trend, 52W Position, Spread Z-Score
Risk Metrics | Beta, Alpha, Sharpe, Sortino, Information Ratio, Volatility
Correlation | Benchmark Correlation, R-Squared, Regime Change Detection
Pair Trade | Peer Correlation, Pair Z-Score, Long/Short Signals
Factor Exposure | Momentum (1/3/6M), Mean Reversion Signal, Distance from SMA50
Drawdown | Current DD, Max DD, Recovery Needed, Ulcer Index, Calmar, VaR
Key Features:
Benchmark-Relative Analysis: Compare any stock vs SET Index or any other benchmark
Pair Trade Signals: Automatically generates long/short signals based on Z-score
Risk-Adjusted Returns: Sharpe, Sortino, Information Ratio - what your clients actually care about
Regime Change Detection: Alert when correlation dynamics shift
Drawdown Risk: VaR, Ulcer Index, Calmar Ratio for risk-conscious clients

TTM Squeeze Pro Enhanced v1.5.1 [pyrevo]# TTM Squeeze Pro Enhanced
**Version:** 1.5.1
**Author:** pyrevo
**License:** MPL 2.0
## Credits
This indicator is a collective work based on the contributions of the TradingView community:
* **John Carter**: Creator of the original TTM Squeeze and TTM Squeeze Pro concepts.
* **Lazybear**: Original interpretation of the TTM Squeeze (Squeeze Momentum Indicator).
* **Makit0**: Evolution of Lazybear's script to factor in TTM Squeeze Pro upgrades (Squeeze PRO Arrows).
* **marsrides**: Some aesthetics solutions.
* **Beardy_Fred**: The base code from which this enhanced version was derived.
## Overview
**TTM Squeeze Pro Enhanced** is a professional-grade momentum and volatility indicator designed to identify explosive breakout opportunities. It is a refined version of the community's collective works, with amendments primarily to the Squeeze Conditions and visual aesthetics to provide a clearer, more actionable reading of market state.
### The Concept
For those unfamiliar with the TTM Squeeze, it is a visual way of seeing how Bollinger Bands (standard deviations from a simple moving average) relate to Keltner Channels (average true range bands) compared with the momentum of the price action.
The concept is that as Bollinger Bands compress within Keltner Channels, price volatility decreases, giving way for a potential explosive price movement up or down.
### TTM Squeeze vs. TTM Squeeze Pro
* **Original TTM Squeeze:** Uses a 1.5 ATR Keltner Channel.
* **TTM Squeeze Pro (Enhanced):** Uses 1.0, 1.5, and 2.0 ATR Keltner Channels.
This helps differentiate between levels of squeeze (compression). The greater the compression (Bollinger Bands moving deeper into tighter Keltner Channels), the more potential for explosive moves.
## Indicator Analysis
### 1. Squeeze Detection (Dots)
The colored dots along the zero line represent the state of market volatility. This enhanced version uses a distinct color palette to indicate compression levels:
* **🔴 Red Dots (High Compression):** Extreme squeeze. One or both Bollinger Bands are inside the 1.0 ATR Keltner Channel.
* **🟠 Orange Dots (Medium Compression):** Significant squeeze. One or both BBs are inside the 1.5 ATR Keltner Channel.
* **⚪ Gray Dots (Low Compression):** Standard squeeze. One or both BBs are inside the 2.0 ATR Keltner Channel.
* **◽ Light Gray Dots (No Squeeze):** Volatility is normal or expanding. Squeeze has "fired".
### 2. Momentum (Histogram)
The histogram bars show price momentum relative to the squeeze:
* **Bright Green:** Positive, increasing momentum (Bullish).
* **Dark Green:** Positive, decreasing momentum (Bullish exhaustion).
* **Bright Red:** Negative, increasing momentum (Bearish).
* **Dark Red:** Negative, decreasing momentum (Bearish exhaustion).
### 3. Dual Momentum System
An optional secondary system to gauge trend strength:
* **Fast & Slow Momentum Lines:** Moving averages of the momentum to help identify crossovers.
* **Trend Crossovers:** Triangle markers indicate when fast momentum crosses slow momentum.
## Ideal Scenario
As the ticker enters the squeeze, **Gray dots** would warn of the beginning of a low compression squeeze. As the Bollinger bands continue to constrict, **Orange dots** would highlight a medium compression. As the price action and momentum continues to compress, a **Red dot** shows warning of high compression.
As price action leaves the squeeze, the coloring would reverse (Red → Orange → Gray → Light Gray). Any compression squeeze is considered "fired" at the first Light Gray dot that appears.
*Note: This is an ideal progression, however any type of squeeze sequence may appear at anytime.*
## Entry and Exit Guide
* **Entry:** John Carter recommends entering a position after at least 5 dots of compression (Gray/Orange/Red) or waiting for the first "No Squeeze" dot (Light Gray) to appear with confirming momentum.
* **Exit:** Exit on the second bar of decreasing momentum (Dark Green or Dark Red), or remain in the position after confirming a continuing trend through a separate indicator.
## Settings & Customization
* **Timeframe:** Built-in Multi-Timeframe (MTF) support allowing you to view higher-timeframe squeeze signals on lower-timeframe charts.
* **Appearance Modes:**
* **Default:** Standard enhanced palette.
* **Modern:** High-contrast palette (Teal/Red/Gold).
* **Classic MACD:** Traditional Blue/Orange line configuration.
* **Dashboard:** An on-chart table providing real-time data on squeeze status, momentum value, and trend strength.

STUDENT WYCKOFF Smart RSISTUDENT WYCKOFF Smart RSI is not just “RSI above 70 / below 30”.
It adapts its levels to volatility, highlights real extreme zones and marks the moments when momentum is leaving them.
Use it to see where buying or selling pressure is truly exhausting and combine it with your own price action and Wyckoff logic.
STUDENT WYCKOFF Smart RSI is a flexible, context-driven version of the classic RSI. It is designed for traders who want to read momentum in a more intelligent way than just “RSI above 70, RSI below 30”.
━━━━━━━━━━
1. Concept
━━━━━━━━━━
Instead of fixing RSI to one rigid set of levels, this script lets you choose how sensitive you want the oscillator to be and how you want to visualize that information:
• Classic 70/30 – standard overbought/oversold bands, familiar to most traders.
• Aggressive 80/20 – fewer but more extreme signals, useful for strong trends.
• Dynamic Std Bands – adaptive zones based on the mean and standard deviation of RSI, so the levels “breathe” with volatility rather than staying flat.
The goal is not to create magic entry signals, but to give you a clean, configurable picture of buying/selling pressure that fits different market conditions and styles of trading.
━━━━━━━━━━
2. RSI logic and plotting
━━━━━━━━━━
• Base indicator: standard RSI calculated on a chosen source (by default – close) with a configurable length.
• Optional smoothing: a short SMA of RSI (signal length) to reduce noise. If you set the smoothing length to 1, the script plots the raw RSI.
• Auto-coloring:
– Above 50 → “bullish pressure” color.
– Below 50 → “bearish pressure” color.
– Around 50 → neutral color.
You can fully customize all colors directly in the settings.
The script can also show:
• Overbought / oversold level lines (depending on the selected mode).
• A middle line at 50 to quickly see which side of the market is dominant.
• Background highlighting when RSI is inside overbought or oversold zones, so you can read the context at a glance without staring at numbers.
━━━━━━━━━━
3. Smart zone exits and signals
━━━━━━━━━━
Instead of signaling every time RSI simply “touches” a level, the script focuses on exits from extreme zones:
• LONG context signal
– RSI has been below the lower band (oversold).
– Then RSI crosses back above this lower band.
– A small green upward triangle is plotted at the RSI value.
• SHORT context signal
– RSI has been above the upper band (overbought).
– Then RSI crosses back below this upper band.
– A small red downward triangle is plotted at the RSI value.
All signals are calculated only on bar close using `barstate.isconfirmed`. This helps reduce repaint-like behaviour and makes the signals more reliable for alerts and discretionary decision-making.
These signals are NOT a complete trading system. They are context markers that tell you: “momentum is leaving an extreme zone, pay attention to the price action, volume and higher-timeframe structure”.
━━━━━━━━━━
4. Alerts
━━━━━━━━━━
The script contains two built-in alertconditions with constant messages:
• STUDENT WYCKOFF Smart RSI LONG – triggers when RSI exits the oversold zone upward.
• STUDENT WYCKOFF Smart RSI SHORT – triggers when RSI exits the overbought zone downward.
To use them:
1. Add the indicator to your chart.
2. Open the Alerts panel in TradingView.
3. Choose this script as the condition.
4. Select one of the available alert names (LONG or SHORT).
5. Set your preferred timeframe, expiry and notification method.
Once configured, the alerts will inform you every time a new arrow appears.
━━━━━━━━━━
5. How to use in practice
━━━━━━━━━━
• Works on any symbol and timeframe supported by TradingView.
• On higher timeframes, the Dynamic Std Bands mode can help you see where RSI is “statistically unusual” relative to its recent behaviour.
• On lower timeframes, Classic or Aggressive modes can help filter noise by waiting for strong expansions of momentum and subsequent exits.
• Combine the signals with your own price action, Wyckoff logic, volume analysis, trend structure and risk management. RSI alone should never be the only reason to enter or exit a position.
━━━━━━━━━━
6. Disclaimer
━━━━━━━━━━
This script is published for educational and analytical purposes only. It does not provide financial, investment or trading advice and does not guarantee any results. Always test tools on historical data, understand the logic behind them and use proper risk management according to your own trading plan.

Profitable Pair Correlation Divergence Scanner v6This strategy identifies divergence opportunities between two correlated assets using a combination of Z-Score spread analysis, trend confirmation, RSI & MACD momentum checks, correlation filters, and ATR-based stop-loss/take-profit management. It’s optimized for positive P&L and realistic trade execution.
Key Features:
Pair Divergence Detection:
Measures deviation between returns of two assets and identifies overbought/oversold spread conditions using Z-Score.
Trend Alignment:
Trades only in the direction of the primary asset’s trend using a fast EMA vs slow EMA filter.
Momentum Confirmation:
Confirms trades with RSI and MACD to reduce false signals.
Correlation Filter:
Ensures the pair is strongly correlated before taking trades, avoiding noisy signals.
Risk Management:
Dynamic ATR-based stop-loss and take-profit ensures proper reward-to-risk ratio.
Exit Conditions:
Automatically closes positions when Z-Score normalizes, or ATR-based exits are hit.
How It Works:
Calculate Returns:
Computes returns for both assets over the selected timeframe.
Z-Score Spread:
Calculates the spread between returns and normalizes it using moving average and standard deviation.
Trend Filter:
Only takes long trades if the fast EMA is above the slow EMA, and short trades if the fast EMA is below the slow EMA.
Momentum Confirmation:
Confirms trade direction with RSI (>50 for longs, <50 for shorts) and MACD alignment.
Correlation Check:
Ensures the pair’s recent correlation is strong enough to validate divergence signals.
Trade Execution:
Opens positions when Z-Score crosses thresholds and all conditions align. Positions close when Z-Score normalizes or ATR-based SL/TP is hit.
Plot Explanation:
Z-Score: Blue line shows divergence magnitude.
Entry Levels: Red/Green lines mark long/short thresholds.
Exit Zone: Gray lines show normalization zone.
EMA Trend Lines: Purple (fast), Orange (slow) for trend alignment.
Correlation: Teal overlay shows current correlation strength.
Usage Tips:
Use highly correlated pairs for best results (e.g., EURUSD/GBPUSD).
Run on higher timeframe charts (1h or 4h) to reduce noise.
Adjust ATR multiplier based on volatility to avoid premature stops.
Combine with alerts for automated notifications or webhook execution.
Conclusion:
The Profitable Pair Correlation Divergence Scanner v6 is designed for traders who want systematic, low-risk, positive P&L trading opportunities with minimal manual monitoring. By combining trend alignment, momentum confirmation, correlation filters, and dynamic exits, it reduces false signals and improves execution reliability.
Run it on TradingView and watch how it captures divergence opportunities while maintaining positive P&L across trades.

BK AK-Momentum Pivot Wolf🐺⚔️ BK AK–Momentum Pivot Wolf — The Court of Price. ⚔️🐺
Not prophecy. Procedure. Not prediction. Judgment.
Most indicators sell you a feeling: “it’s going up.”
Pivot Wolf is built to do the opposite: make the market prove it—under rules.
Price lies. Not maliciously—mechanically.
It prints motion whether there’s intent behind it or not. That’s why traders get slaughtered: they treat movement like truth.
Pivot Wolf treats movement like a defendant.
⚖️ The Law of the Tool (What It Refuses to Do)
This script does not exist to “call tops and bottoms.”
It exists to remove the sin that ruins traders:
answering before hearing.
If you trade before testimony, you’re not trading—you’re volunteering.
So Pivot Wolf is designed to withhold permission until three things line up:
Pivots = Boundary Stones
Where price must answer. Where excuses die. Where decisions become visible.
Momentum = Witness
Not what price did—what it carried. Force behind the move, not the costume of the candle.
Acceleration = Confession
The moment intent leaks. The early tell that strength is arriving—or that strength is bleeding out.
You’re not hunting “signals.”
You’re watching a case get built.
🪨 Solomon’s Hidden Layer (Why This Is a Wisdom Tool)
Solomon’s world wasn’t obsessed with forecasting. It was obsessed with right judgment.
He didn’t ask, “What do I want to happen?”
He asked, “What’s true—and what is counterfeit?”
That’s why his writing keeps returning to the same themes:
Weights & measures (standardization over vibes)
Witnesses (confirmation over impulse)
Gates & boundaries (permissioned action over chaos)
Silence (restraint as intelligence)
Pivot Wolf is built in that spirit: it’s a weights-and-witness engine disguised as an indicator.
It’s trying to keep you from trading counterfeit strength at the edge of a boundary.
🐺 How to Use It Like You Actually Respect Capital
1) Campaign Mode (Trend):
Boundaries tell you where business is allowed. Momentum/acceleration tell you whether business is justified. You press when testimony is clean—not when price is exciting.
2) Verdict Mode (Turns):
Reversals aren’t vibes. They’re a collapse of testimony: momentum fails at the boundary, acceleration flips, and the move confesses exhaustion.
3) Stand-Down Mode (The Feature Tourists Hate):
When the script goes quiet, it’s not “missing trades.”
It’s telling you: the court is not in session.
That’s the part that keeps your P&L alive.
🏷️ BK / AK
BK is the mark I’m building.
AK is honor—my mentor’s standard: clarity, patience, no shortcuts.
Above that: gratitude to Gd, the true source of wisdom, restraint, and endurance.
📜 King Solomon Lens
“Solomon didn’t predict. He judged. He built tests that made truth show itself. Pivot Wolf is that: pivots as boundary stones, momentum as witness, acceleration as the confession. No hammer in the Temple — rules are cut before entry. When it’s quiet, it’s saving you. When it speaks, it’s a ruling.”
This is not financial advice. This is structure.
If you wanted a fortune teller, you’ll hate this script.
If you wanted a system that makes the market prove itself before you strike—welcome to the Wolf.
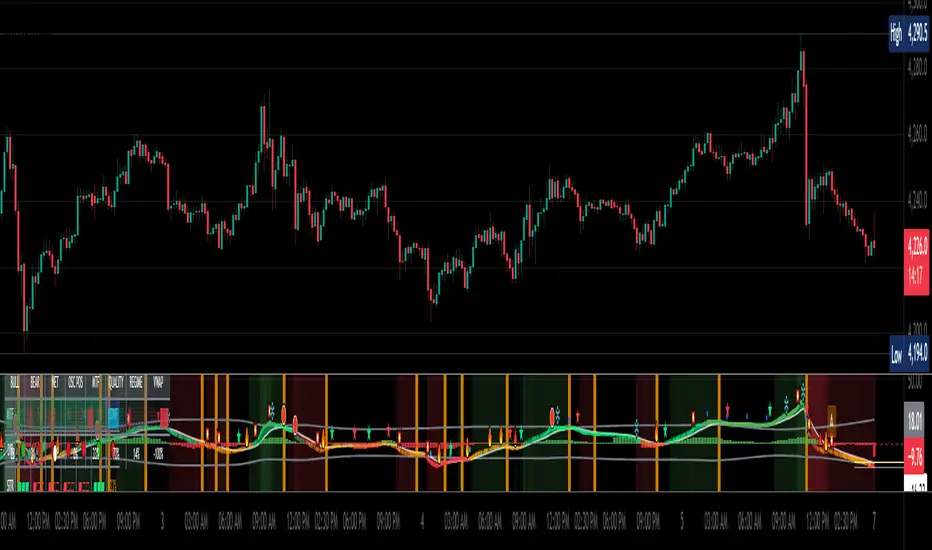
US Market Long Horizon Momentum Summary in one paragraph
US Market Long Horizon Momentum is a trend following strategy for US index ETFs and futures built around a single eighteen month time series momentum measure. It helps you stay long during persistent bull regimes and step aside or flip short when long term momentum turns negative.
Scope and intent
• Markets. Large cap US equity indices, liquid US index ETFs, index futures
• Timeframes. 4h/ Daily charts
• Default demo used in the publication. SPY on 4h timeframe chart
• Purpose. Provide a minimal long bias index timing model that can reduce deep drawdowns and capture major cycles without parameter mining
• Limits. This is a strategy. Orders are simulated on standard candles only
Originality and usefulness
• Unique concept or fusion. One unscaled multiple month log return of an external benchmark symbol drives all entries and exits, with optional volatility targeting as a single risk control switch.
• Failure mode addressed. Fully passive buy and hold ignores the sign of long horizon momentum and can sit through multi year drawdowns. This script offers a way to step down risk in prolonged negative momentum without chasing short term noise.
• Testability. All parameters are visible in Inputs and the momentum series is plotted so users can verify every regime change in the Tester and on price history.
• Portable yardstick. The log return over a fixed window is a unit that can be applied to any liquid symbol with daily data.
Method overview in plain language
The method looks at how far the benchmark symbol has moved in log return terms over an eighteen month window in our example. If that long horizon return is positive the strategy allows a long stance on the traded symbol. If it is negative and shorts are enabled the strategy can flip short, otherwise it goes flat. There is an optional realised volatility estimate on the traded symbol that can scale position size toward a target annual volatility, but in the default configuration the model uses unit leverage and only the sign of momentum matters.
Base measures
Return basis. The core yardstick is the natural log of close divided by the close eighteen months ago on the benchmark symbol. Daily log returns of the traded symbol feed the realised volatility estimate when volatility targeting is enabled.
Components
• Component one Momentum eighteen months. Log of benchmark close divided by its close mom_lookback bars ago. Its sign defines the trend regime. No extra smoothing is applied beyond the long window itself.
• Component two Realised volatility optional. Standard deviation of daily log returns on the traded symbol over sixty three days. Annualised by the square root of 252. Used only when volatility targeting is enabled.
• Optional component Volatility targeting. Converts target annual volatility and realised volatility into a leverage factor clipped by a maximum leverage setting.
Fusion rule
The model uses a simple gate. First compute the sign of eighteen month log momentum on the benchmark symbol. Optionally compute leverage from volatility. The sign decides whether the strategy wants to be long, short, or flat. Leverage only rescales position size when enabled and does not change direction.
Signal rule
• Long suggestion. When eighteen month log momentum on the benchmark symbol is greater than zero, the strategy wants to be long.
• Short suggestion. When that log momentum is less than zero and shorts are allowed, the strategy wants to be short. If shorts are disabled it stays flat instead.
• Wait state. When the log momentum is exactly zero or history is not long enough the strategy stays flat.
• In position. In practice the strategy sits IN LONG while the sign stays positive and flips to IN SHORT or flat only when the sign changes.
Inputs with guidance
Setup
• Momentum Lookback (months). Controls the horizon of the log return on the benchmark symbol. Typical range 6 to 24 months. Raising it makes the model slower and more selective. Lowering it makes it more reactive and sensitive to medium term noise.
• Symbol. External symbol used for the momentum calculation, SPY by default. Changing it lets you time other indices or run signals from a benchmark while trading a correlated instrument.
Logic
• Allow Shorts. When true the strategy will open short positions during negative momentum regimes. When false it will stay flat whenever momentum is negative. Practical setting is tied to whether you use a margin account or an ETF that supports shorting.
Internal risk parameters (not exposed as inputs in this version) are:
• Target Vol (annual). Target annual volatility for volatility targeting, default 0.2.
• Vol Lookback (days). Window for realised volatility, default 63 trading days.
• Max Leverage. Cap on leverage when volatility targeting is enabled, default 2.
Usage recipes
Swing continuation
• Signal timeframe. Use the daily chart.
• Benchmark symbol. Leave at SPY for US equity index exposure.
• Momentum lookback. Eighteen months as a default, with twelve months as an alternative preset for a faster swing bias.
Properties visible in this publication
• Initial capital. 100000
• Base currency. USD
• Default order size method. 5% of the total capital in this example
• Pyramiding. 0
• Commission. 0.03 percent
• Slippage. 3 ticks
• Process orders on close. On
• Bar magnifier. Off
• Recalculate after order is filled. Off
• Calc on every tick. Off
• All request.security calls use lookahead = barmerge.lookahead_off
Realism and responsible publication
The strategy is for education and research only. It does not claim any guaranteed edge or future performance. All results in Strategy Tester are hypothetical and depend on the data vendor, costs, and slippage assumptions. Intrabar motion is not modeled inside daily bars so extreme moves and gaps can lead to fills that differ from live trading. The logic is built for standard candles and should not be used on synthetic chart types for execution decisions.
Performance is sensitive to regime structure in the US equity market, which may change over time. The strategy does not protect against single day crash risk inside bars and does not model gap risk explicitly. Past behavior of SPY and the momentum effect does not guarantee future persistence.
Honest limitations and failure modes
• Long sideways regimes with small net change over eighteen months can lead to whipsaw around the zero line.
• Very sharp V shaped reversals after deep declines will often be missed because the model waits for momentum to turn positive again.
• The sample size in a full SPY history is small because regime changes are infrequent, so any test must be interpreted as indicative rather than statistically precise.
• The model is highly dependent on the chosen lookback. Users should test nearby values and validate that behavior is qualitatively stable.
Legal
Education and research only. Not investment advice. You are responsible for your own decisions. Always test on historical data and in simulation with realistic costs before any live use.

Kurtosis with Skew Crossover Focused OscillatorDescription:
This indicator highlights Skewness/Kurtosis crossovers for short-term trading:
Green upward arrows: Skew crosses above Kurtosis → potential long signal.
Red downward arrows: Skew crosses below Kurtosis → potential short signal.
Yellow upward arrows: Extreme negative skew (skew ≤ -1.7) → potential oversold/reversal opportunity.
Oscillator Pane:
Orange = Skewness (smoothed)
Blue = Kurtosis (adjusted, smoothed)
Zero line = visual reference
Usage:
Primarily for 2–5 minute charts, highlighting statistical anomalies and potential short-term reversals that can be used in conjunction with OBV and/or CVD
Arrows signal potential entries based on skew/kurt dynamics.
Potential ideas???????
---------------------------------------
Add Supporting Market Context
---------------------------------------
Currently, signals are purely based on skew/kurt crossovers. Adding supporting indicators could improve reliability:
Volume / CVD: Identify when crossovers occur with real buying/selling pressure.
Wick Imbalance: Detect forced moves in price structure.
Volatility Regime (Parkinson / ATR): Filter signals during high volatility spikes or compressions.
Experimentation: Try weighting these supporting signals to dynamically confirm or filter skew/kurt crossovers and see if false signals decrease on 2–5 minute charts.
--------------------------------------
Dynamic Thresholds & Scaling
--------------------------------------
Right now, the extreme skew signal is triggered at a fixed level (skew ≤ -1.7). Future improvements could include:
Adaptive thresholds: Scale extreme skew levels based on recent standard deviation or intraday volatility.
Kurtosis thresholds: Introduce a cutoff for kurtosis to identify “fat-tail” events.
Experimentation: Backtest different adaptive thresholds for both skew and kurt, and see how it affects the precision vs. frequency of signals.
--------------------------------------------------
Multi-Timeframe or Combined Oscillator
--------------------------------------------------
Skew/kurt signals could be combined across multiple intraday timeframes (e.g., 1-min, 3-min, 5-min) to improve confirmation.
Create a composite oscillator that blends short-term and slightly longer-term skew/kurt values to reduce noise.
Experimentation: Compare a single timeframe approach vs multi-timeframe composite, and measure signal reliability and lag.
I'm leaving this open so anyone can experiment with it as this project may be on the backburner, but these are my thoughts so far
