Trended CVD [Mxwll]Hey!
This indicator "Trended CVD" categorizes price movement by trend (using zig zag) and calculates cumulative volume delta for the entirety of the price move.
Features
CVD calculated for the trend
CVD divergences are distinguished (uptrend and falling CVD / downtrend and rising CVD)
CVD output normalized to scale with chart, and is plotted alongside the trend
Can be used for trend confirmation (CVD trend correlating with price trend)
All regular zig-zag features available
What constitutes a trend is customizable. Can locate small, medium, large price trends with detailed user-input settings.
How-To Use Trended CVD
The image above shows one of two primary uses for the indicator.
In the left-half of the image, price is downtrending simultaneously with CVD; thereby, CVD is confirming the downtrend.
The right-half of the image shows price uptrending simultaneously with CVD; CVD is confirming the uptrend.
This information can be used to classify the "strength" of the price move, and decide to trade with it or against it.
The image above shows the second primary use for the indicator.
A slight price decrease transpires while CVD increases - CVD diverging upwards from the price trend.
This information can be used to classify the strength of the downtrend, and decide to trade against it, or abstain from trading with it.
The image above shows, subsequent to divergence, price failed to sustain "meaningful" downwards movement.
Labels oriented at the final pivot of a trend show the cumulative volume delta for the entirety of the price move (distinguishable by the superimposed zig zag line).
That's really it! A more complex concept integrated with a simple output.
Thank you!
Delta

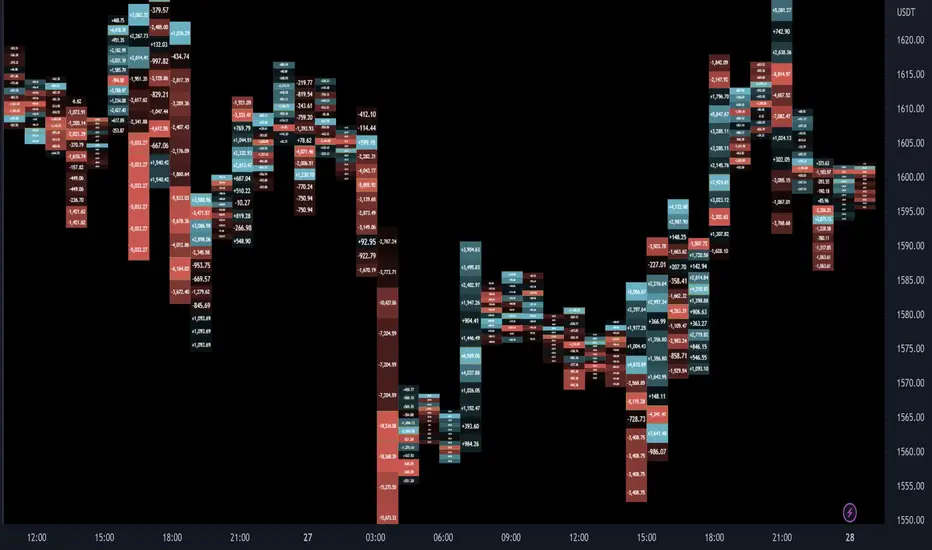
Intraday Volume Profile [BigBeluga]The Intraday Volume Profile aims to show delta volume on lower timeframes to spot trapped shorts at the bottom or trapped longs at the top, with buyers pushing the price up at the bottom and sellers at the top acting as resistance.
🔶 FEATURES
The indicator includes the following features:
LTF Delta precision (timeframe)
Sensibility color - adjust gradient color sensitivity
Source - source of the candle to use as the main delta calculation
Color mode - display delta coloring in different ways
🔶 DELTA EXAMPLE
In the image above, we can see how delta is created.
If delta is positive, we know that buyers have control over sellers, while if delta is negative, we know sellers have control over buyers.
Using this data, we can spot interesting trades and identify trapped individuals within the candle.
🔶 HOW TO USE
In the image above, we can see how shorts are trapped at the bottom of the wick (red + at the bottom), leading to a pump also called a "short squeeze."
Same example as before, but with trapped longs (blue + at the top).
This can also work as basic support and resistance, for example, trapped shorts at the bottom with positive delta at the bottom acting as strong support for price.
Users can have the option to also display delta data within the corresponding levels, showing Buyers vs Sellers for more precise trading ideas.
NOTE:
User can only display the most recent data for the last 8 buyers and sellers.
It is recommended to use a hollow candle while using this script.

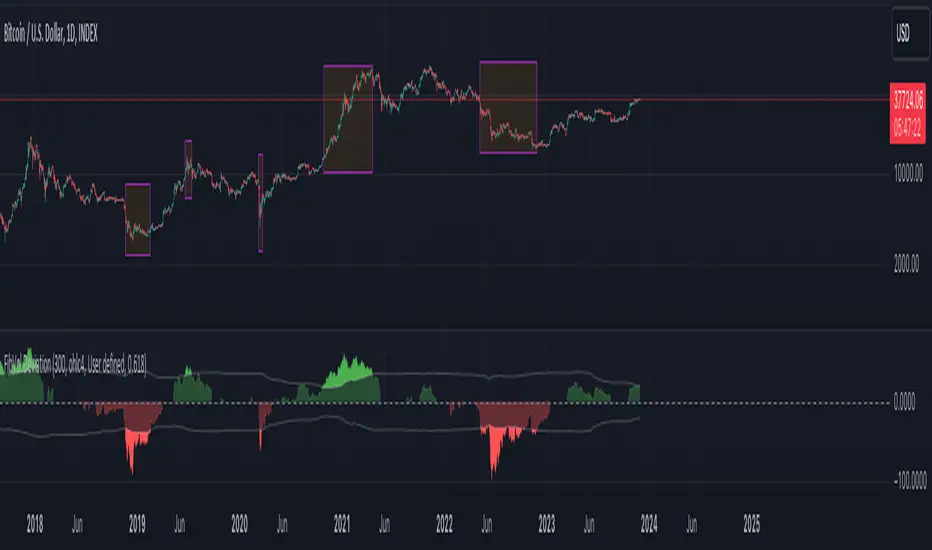
Fibonacci Bollinger Volume Weighted DeviationDiscover market dynamics with the 'Fibonacci Bollinger Volume Weighted Deviation' indicator – a unique tool blending Fibonacci ratios, Bollinger Bands, and volume-weighted analysis. Ideal for spotting overbought/oversold conditions and potential market turnarounds, this indicator is a must-have for traders seeking nuanced insights into price behavior and volatility.
Description:
"The 'Fibonacci Bollinger Volume Weighted Deviation' indicator presents a novel approach to market trend analysis by integrating Fibonacci ratios with the classic concept of Bollinger Bands. Designed for traders who incorporate Fibonacci levels in their market analysis, this indicator adapts Bollinger Bands to a user-defined Fibonacci ratio. It creates dynamic upper and lower bands around a Simple Moving Average (SMA), offering insights into price deviations and potential overbought or oversold market states.
Incorporating volume data, this indicator provides a volume-weighted perspective of price deviations. This feature is crucial in gauging the market sentiment, as significant volumes linked with price deviations can signal strong market moves. By plotting these deviations and emphasizing those that significantly diverge from the volume-weighted average, it aids in pinpointing potential turning points or key support and resistance zones.
Versatile in nature, the 'Fibonacci Bollinger Volume Weighted Deviation' indicator is adaptable to various trading styles and market conditions. It proves especially valuable in markets where Fibonacci levels are a key factor. Traders can explore long positions when prices fall below the lower band and consider short positions when prices breach the upper band. The addition of volume-weighted deviation analysis refines these trading signals, offering a more sophisticated and nuanced decision-making process for entries and exits.
As a standalone tool or in conjunction with other technical instruments, this indicator is an invaluable addition to any technical analyst's toolkit. It not only enhances traditional Fibonacci and Bollinger Band methodologies but also integrates volume analysis to provide a comprehensive view of market trends and movements."
Bull Vs Bear Visible Range VP [Kioseff Trading]Hello!
This Script “Bull vs Bear Visible Range VP” Calculates Bull & Bear Volume Profiles for the Visible Range Alongside a Delta Ladder for the Visible Period!
Features
Volume Profile Anchored to Visible Range
Delta Ladder Anchored to Visible Range
Bull vs Bear Profiles!
Standard Poc and Value Area Lines, in Addition to Separated POCs and Value Area Lines for Bull Profiles and Bear Profiles
Configurable Value Area Target
Curved Profiles
Up to 9999 Profile Rows per Visible Range
Stylistic Options for Profiles
This Script Generates Bull vs. Bear Volume Profiles for the Visible Range!
Up to 9999 Volume Profile Levels (Price Levels) Can Be Calculated for Each Profile, Thanks to the New Polyline Feature, Allowing For Less Aggregation / More Precision of Volume at Price and Volume Delta.
Bull vs Bear Profiles
The Image Above Shows Primary Functionality!
Green Profiles = Buying Volume
Red Profiles = Selling Volume
Bullish & Bearish Pocs for the Visible Range Are Displayable!
Profiles Can Be Anchored on the Left Side for a More Traditional Look.
The indicator is robust enough to calculate on "small price periods", or for a price period spanning your entire chart fully zoomed out!
That’s About It :D
This Indicator Is Part of a Series Titled “Bull vs. Bear” - A Suite of Profile-Like Indicators I Will Be Releasing Over Coming Days. Thanks for Checking This Out!
If You Have Any Suggestions Please Feel Free to Share!

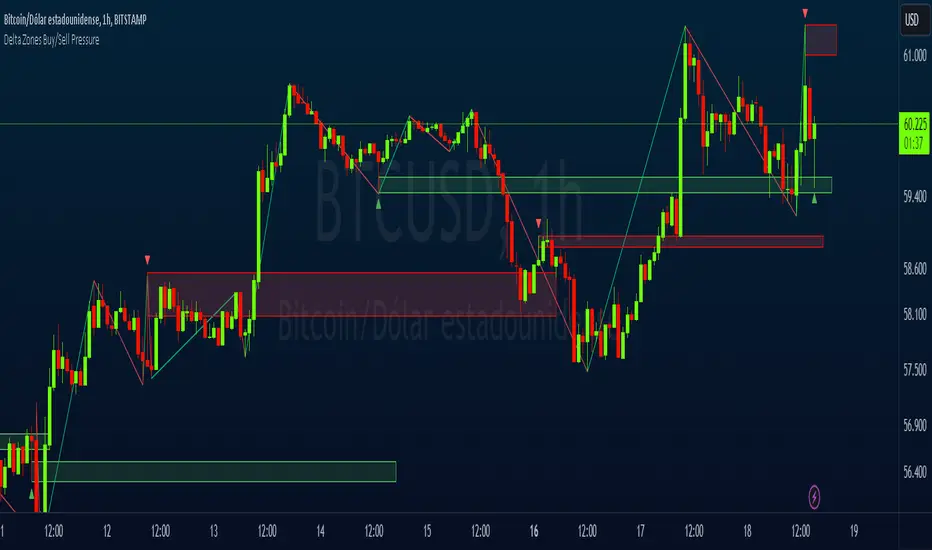
Delta Zones Buy/Sell PressureScript Description:
Delta Zones Buy/Sell Pressure Indicator
Description:
The "Delta Zones Buy/Sell Pressure" indicator, created by the original author "scarf", is a technical tool that unveils key areas of buying and selling pressure in the market. This indicator utilizes the concept of Delta, calculating differences between open, close, high, and low prices. When these differences exceed a threshold determined by the user-defined standard deviation, areas of intense buying (indicated by green boxes) and selling pressure (indicated by red boxes) on the chart are identified.
How It Works:
The indicator calculates Delta using various combinations of candle prices to determine buying and selling pressure. When Delta surpasses a certain level, indicated by the user-defined standard deviation, visual signals in the form of boxes on the chart are generated. These boxes highlight specific areas where buying or selling pressure is particularly strong, aiding traders in identifying potential entry and exit points in the market.
How to Use:
* When a green box is drawn, it indicates strong buying pressure in the market. This can be interpreted as a signal to consider long positions.
* When a red box is drawn, it indicates strong selling pressure in the market. This can be interpreted as a signal to consider short positions.
* Use these signals in combination with your own analysis and risk management strategies to make informed trading decisions.
Originality:
What makes this indicator original is its unique approach to identifying specific areas of buying and selling pressure. By calculating Delta in multiple ways and utilizing standard deviation as a filter, this indicator provides clear and concise visual signals about market activity. The combination of these features distinguishes it as a valuable tool for traders seeking a better understanding of market behavior. This modification differs from the original by displaying the information on the price chart with horizontal bars, below each delta, instead of an oscillator at the bottom similar to the volume indicator.
Final Recommendations:
Consider Market Trends:
Before making any trading decisions using the Delta Zones Buy/Sell Pressure Indicator, it is crucial to analyze the prevailing market trends. Assess the overall direction of the market, whether it's trending upward, downward, or moving sideways. Align your trades with the dominant trend to increase the probability of successful outcomes. The indicator's signals can be more reliable when they align with the broader market trend.
Evaluate Macro-Economic Factors:
Additionally, take into account macro-economic factors that could influence price movements. Factors such as economic indicators, geopolitical events, interest rate decisions, and global market sentiments can significantly impact the financial markets. Stay updated with relevant news and economic reports to anticipate potential market shifts. Understanding the broader economic context can help you interpret the indicator's signals within a more informed framework.
Practice Risk Management:
Regardless of the signals provided by the Delta Zones Buy/Sell Pressure Indicator, always implement effective risk management strategies. This includes setting stop-loss orders, diversifying your portfolio, and only risking a small percentage of your trading capital on each trade. By managing your risk, you can protect your investments and ensure longevity in the market, even during volatile periods.
Continuous Learning and Adaptation:
Financial markets are dynamic and constantly evolving. Continuously educate yourself about new trading strategies, technical analysis tools, and economic developments. Stay open to adapting your trading approach based on changing market conditions. Regularly reviewing your trading strategy and adjusting it according to your experiences and market feedback can significantly enhance your trading performance over the long term.
Seek Professional Advice if Necessary:
If you are uncertain about specific market trends, indicators, or economic factors, don't hesitate to seek guidance from financial advisors or professionals. Their expertise can provide valuable insights and help you make well-informed decisions, especially in complex or uncertain market environments.
By incorporating these recommendations into your trading approach, you can enhance your decision-making process, mitigate risks, and increase your overall chances of successful trading outcomes. Remember, the key to successful trading lies not only in the tools you use but also in your ability to interpret them within the broader market context.
Market Sessions and TPO (+Forecast)This indicator "Market Sessions and TPO (+Forecast)" shows various market sessions alongside a TPO profile (presented as the traditional lettering system or as bars) and price forecast for the duration of the session.
Additionally, numerous statistics for the session are shown.
Features
Session open and close times presented in boxes
Session pre market and post market shown
TPO profile generated for each session (normal market hours only)
A forecast for the remained of the session is projected forward
Forecast can be augmented by ATR
Naked POCs remain on the chart until violated
Volume delta for the session shown
OI Change for the session shown (Binance sourced)
Total volume for the session shown
Price range for the session shown
The image above shows processes of the indicator.
Volume delta, OI change, total volume and session range are calculated and presented for each session.
Additionally, a TPO profile for the most recent session is shown, and a forecast for the remainder of the active session is shown.
The image above shows an alternative display method for the session forecast and TPO profile!
Additionally, the pre-market and post-market times are denoted by dashed boxes.
The image above exemplifies additional capabilities.
That's all for now; further updates to come and thank you for checking this out!
And a special thank you to @TradingView of course, for making all of this possible!

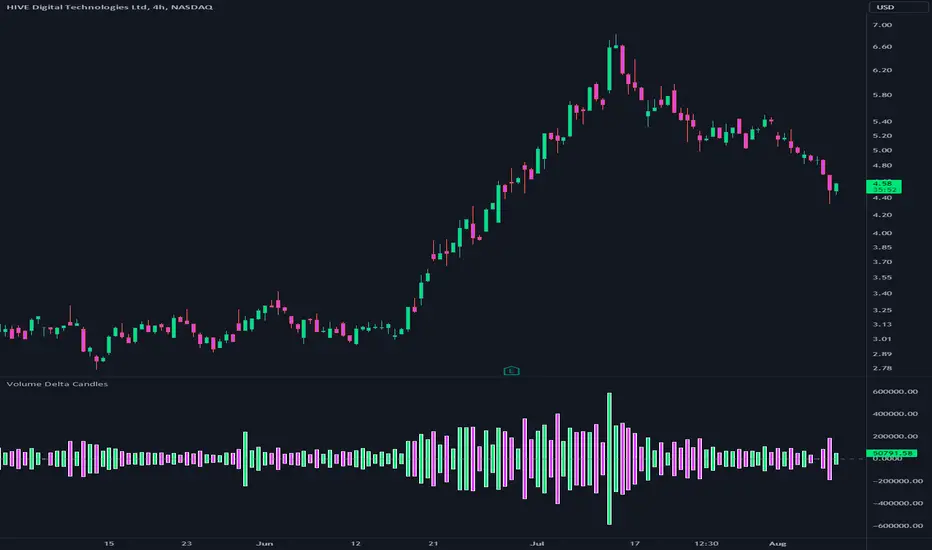
Volume Delta CandlesThis indicator is designed to visualize the volume delta, which represents the difference between buying and selling volumes during each candle period. The indicator plots custom candlesticks on the chart, with OHLC values calculated based on the volume delta.
Calculations:
To calculate the volume delta, the indicator first determines the buying and selling volumes. If the closing price is higher than the opening price (close > open), the volume is considered as buying volume. If the closing price is lower than the opening price (close < open), the volume is considered as selling volume. Otherwise, the volume is set to zero. The volume delta is then calculated as the difference between the buying volume and the selling volume.
The custom OHLC values are derived from the volume delta. The custom open is obtained by subtracting the volume delta from the closing price. The custom close is obtained by adding the volume delta to the closing price. The custom high is set as the maximum value between the closing price and the custom open, ensuring that the candle represents the highest value within the range. The custom low is set as the minimum value between the closing price and the custom open, ensuring that the candle represents the lowest value within the range.
Interpretation:
The indicator's custom candles provide visual insights into the volume delta. Each candlestick's color (lime for positive volume delta, fuchsia for negative volume delta) indicates the dominance of buying or selling pressure during that period. When the volume delta is positive, it suggests that buying volume exceeded selling volume, possibly indicating a bullish sentiment. Conversely, when the volume delta is negative, it indicates that selling volume was higher, potentially signaling a bearish sentiment. The indicator also plots a zero line to represent the equilibrium point, where buying and selling volumes are equal.
Potential Uses and Limitations:
Traders can use the indicator to gain insights into the strength and direction of buying and selling pressures. Positive volume delta during an uptrend could suggest the presence of strong buying interest, potentially supporting further bullish moves. On the other hand, negative volume delta during a downtrend could indicate intensified selling pressure, hinting at potential further declines. Traders might use the indicator in conjunction with other technical analysis tools, such as support and resistance levels, trendlines, or oscillators, to confirm potential reversal points or trend continuations.
It's essential to interpret the indicator in the context of the overall market environment. While volume delta can provide valuable insights into short-term buying and selling imbalances, it is just one aspect of market analysis. Traders should consider other factors, such as market structure, fundamental events, and overall sentiment, to make informed trading decisions. Additionally, the indicator's efficacy might vary across different market conditions, and it may produce false signals during low-volume periods or choppy markets.
Conclusion:
By visualizing volume delta through custom candlesticks, traders can gauge market sentiment and potentially identify key reversal or continuation points. As with any technical indicator, it is advisable to use the Volume Delta Candles in combination with other tools to gain a comprehensive understanding of market conditions and make well-informed trading choices. Additionally, traders should practice proper risk management techniques to protect their capital while using the indicator in their trading strategy.
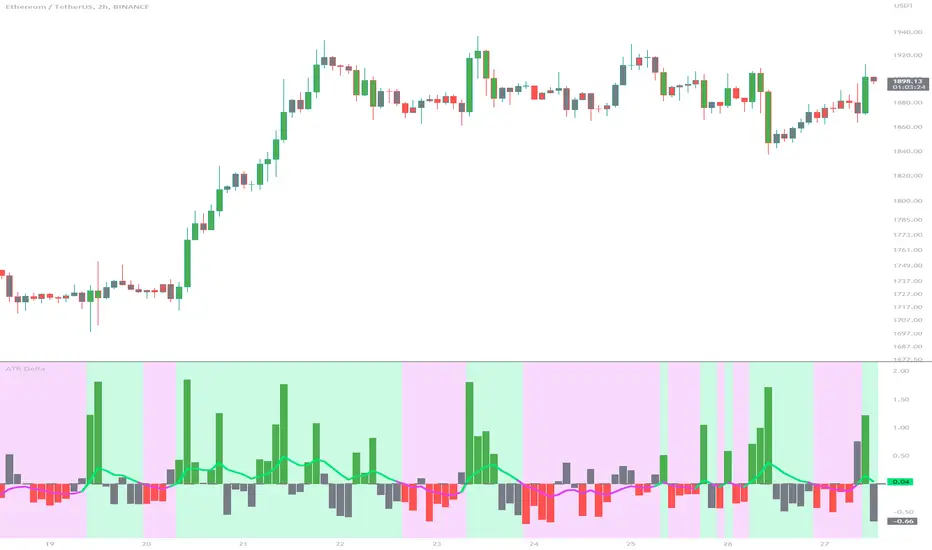
ATR DeltaThe ATR Delta indicator is based on the concept of Average True Range (ATR), which reflects the average price range over a specified period. By calculating the difference between current and previous ATR values, the ATR Delta provides valuable insights into volatility shifts in the market. This information can help traders identify periods of heightened or diminished price movement, enabling them to adjust their strategies accordingly.
The ATR Delta indicator consists of two main calculations:
-- ATR Calculation : The Average True Range (ATR) is calculated using the specified length parameter. It measures the average price range (including gaps) during that period. A larger ATR value indicates higher volatility, while a smaller value indicates lower volatility.
-- ATR Delta Calculation : The ATR Delta is calculated by subtracting the ATR value of the previous bar from the current ATR value. This calculation captures the change in volatility between the two periods, providing a measure of how volatility has evolved.
Positive ATR Delta values indicate an increase in volatility compared to the previous period. It suggests that price movements have expanded, potentially indicating a more active market. On the other hand, negative ATR Delta values indicate a decrease in volatility compared to the previous period. It suggests that price movements have contracted, potentially signaling a calmer or range-bound market.
The ATR Delta indicator uses coloration to visually represent the relationship between the ATR Delta, zero, and a signal line:
-- Green color is assigned when the ATR Delta is positive, above the signal line, and increasing. This coloration suggests a scenario of higher volatility, as the market is experiencing upward momentum in price swings.
-- Red color is assigned when the ATR Delta is negative, below the signal line, and decreasing. This coloration suggests a scenario of lower volatility, as the market is experiencing downward momentum in price swings.
-- Gray color is assigned for other cases when the ATR Delta and signal line relationship does not meet the above conditions.
These colors are reflected in the columns of the ATR Delta as well as the bar coloration.
The ATR Delta indicator includes a signal line, which acts as a reference for interpreting the ATR Delta values. The signal line is calculated as a moving average (EMA) of the ATR Delta over a specified length. It helps smooth out the ATR Delta fluctuations, providing a clearer indication of the underlying trend in volatility changes. When the ATR Delta crosses above the signal line, it may suggest a potential increase in volatility, indicating a market that is becoming more active. Conversely, when the ATR Delta crosses below the signal line, it may suggest a potential decrease in volatility, indicating a market that is becoming less active.
The coloration of the signal line in the ATR Delta indicator helps to differentiate between positive and negative values and provides further insight into market sentiment. When the signal line is positive, indicating increasing volatility, it is colored lime. This color choice reinforces the bullish sentiment and signifies potential opportunities for trend continuation or breakouts. On the other hand, when the signal line is negative, indicating decreasing volatility, it is colored fuchsia. This color choice highlights the bearish sentiment and suggests potential range-bound or consolidation periods. These colors are reflected in the background of the indicator.
The ATR Delta indicator offers several potential applications for traders:
-- Volatility Analysis : The ATR Delta is invaluable for understanding and analyzing volatility dynamics in the market. Traders can observe the changes in ATR Delta values and use them to assess the current level of price movement. This information can help determine the appropriate strategies and risk management approaches.
-- Breakout Strategies : Traders often use the ATR Delta to identify periods of increased volatility, which frequently accompany breakouts. By monitoring the ATR Delta, traders can anticipate potential price breakouts and adjust their entry and exit levels accordingly.
-- Trend Confirmation : Combining the ATR Delta with trend-following indicators allows traders to validate the strength of a trend. Higher ATR Delta values during an uptrend may indicate stronger momentum and a higher likelihood of continuation. Conversely, lower ATR Delta values during a downtrend may suggest a potential consolidation phase or trend reversal.
Limitations :
-- Lagging Indicator : The ATR Delta indicator is based on historical data and calculates the difference between current and previous ATR values. As a result, it may lag behind real-time market conditions. Traders should be aware of this delay and consider it when making trading decisions. It is advisable to combine the ATR Delta with other indicators or price action analysis for a more comprehensive assessment of market conditions.
-- Parameter Sensitivity : The ATR Delta indicator's effectiveness can be influenced by the selection of its parameters, such as the length of the ATR and signal line. Different market conditions may require adjustments to these parameters to better capture volatility changes. Traders should carefully test and optimize the indicator's parameters to align with the characteristics of the specific market or asset they are trading.
-- Market Regime Changes : The ATR Delta indicator assumes that volatility changes occur gradually. However, in rapidly changing market regimes or during news events, volatility can spike or drop abruptly, potentially rendering the indicator less effective. Traders should exercise caution and consider using additional tools or techniques to identify and adapt to such market conditions.
The ATR Delta indicator is a valuable tool for traders seeking to analyze and monitor volatility dynamics in the market. By calculating the difference between current and previous ATR values, it provides insights into changes in price movement and helps identify periods of increased or decreased volatility. Traders can leverage the ATR Delta to fine-tune their strategies, validate trend strength, and identify potential breakout opportunities. However, it is essential to recognize the limitations of the indicator, including its lagging nature and sensitivity to parameter selection. By combining the ATR Delta with other technical analysis tools and applying sound risk management practices, traders can enhance their decision-making process and potentially improve their trading outcomes.
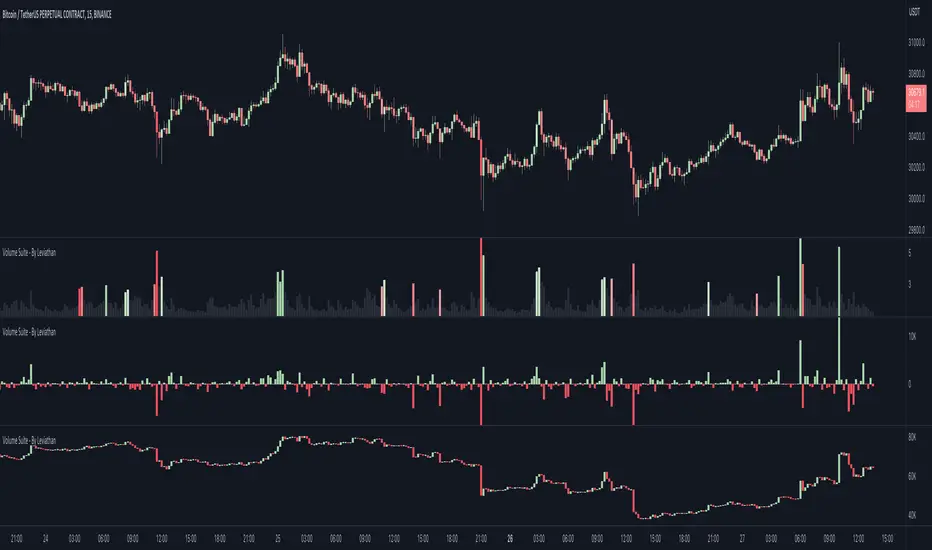
Volume Suite - By Leviathan (CVD, Volume Delta, Relative Volume)Volume Suite is an all-in-one script that includes several volume-based indicators such as CVD, Volume Delta, Relative Volume, Buy/Sell Volume, Cumulative Relative Volume and more. Additionally, it offers fully customisable appearance and features for improved data visualization, such as highlights for high volume activity, small price changes with high volume, or large price changes with low volume and more.
Data available in version 1:
- Volume Delta
Volume Delta is the net difference between Buy Volume and Sell Volume at a given bar. Positive Delta indicates that Buy Volume > Sell Volume, while Negative Delta means that Sell Volume > Buy Volume. As there is not way to get tick data on Tradingview, calculating Volume Delta is improvised by using the direction of lower timeframe candles and their volume.
- Cumulative Volume Delta (CVD)
CVD is a running total/cumulation of Volume Delta values, where positive VD gets added to the sum and negative VD gets subtracted from the sum. It can be used for trend strength analysis, divergence strategies, sentiment, etc.
- Buy/Sell Volume
Buy and Sell Volume provides an insight into volume activity in a given bar by estimating the buying/selling volume based on the direction of lower timeframe candles and their volume.
- Relative Volume
Relative Volume is used to compare current trading volume to past trading volume over a given period. For instance, a relative volume of 1.0 indicates that volume is at an average level, while a relative volume of 2.0 suggests that the volume is twice as high as the average.
- Cumulative Relative Volume (CRVOL)
CRVOL is a running total/cumulation of Relative Volume values, where RVOL at close>open gets added to the sum and RVOL at close
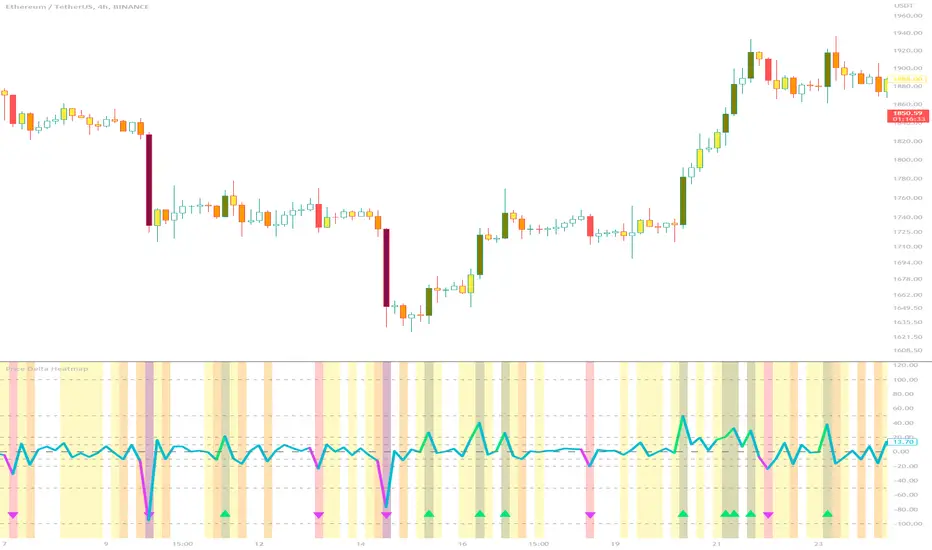
Price Delta HeatmapThe Price Delta Heatmap is an indicator designed to visualize the price changes of an asset over time. It helps traders identify and analyze significant price movements and potential volatility. The indicator calculates the price delta, which is the difference between the current close price and the previous close price. It then categorizes the price deltas into different color ranges to create a heatmap-like display on the chart.
The indicator uses user-defined thresholds to determine the color ranges. These thresholds represent the minimum price change required for a specific color to be assigned. The thresholds are adjustable to accommodate different asset classes and trading strategies. Positive price deltas are associated with bullish movements, while negative price deltas represent bearish movements.
The indicator plots bars color-coded according to the price delta range it falls into. The color ranges can be customized to match personal preferences or specific trading strategies. Additionally, the indicator includes signal shapes below the bars to highlight significant positive or negative price deltas. Traders can adjust the threshold values based on their preferred sensitivity to price changes. Higher threshold values may filter out minor price movements and focus on more significant shifts, while lower threshold values will capture even minor fluctuations.
****The default settings have the thresholds set to levels of 100, 50, 20, 10, 0, -10, -20, -50, and -100. These numbers are well-suited for assets such as Ethereum or Bitcoin which are larger in price than an asset that has a price of $1.50, for example. To compensate, adjust the thresholds in the settings to reflect the price delta on the desired asset. All coloration and horizontal line plots will adjust to reflect these changes.****
Traders can interpret the Price Delta Heatmap as follows:
-- Bright green bars indicate the highest positive price deltas, suggesting strong bullish price movements.
-- Green bars represent positive price deltas above the third threshold, indicating significant bullish price changes.
-- Olive bars indicate positive price deltas above the second threshold, suggesting moderate bullish price movements.
-- Yellow bars represent positive price deltas above the lowest threshold, indicating minor bullish price changes. This color is reflected on the negative side as well. Yellow bars below zero indicate negative price deltas below the lowest threshold, suggesting minor bearish price changes.
-- White bars represent zero price deltas, indicating no significant price movement.
-- Orange bars represent negative price deltas below the second threshold, indicating moderate bearish price movements.
-- Red bars indicate negative price deltas below the third threshold, suggesting significant bearish price changes.
-- Maroon bars represent the lowest negative price deltas, indicating strong bearish price movements.
The coloration of the Price Delta line itself is determined by the line's relation to the second positive and second negative thresholds (default +/- 20) - if the line is above the second positive threshold, the line is colored lime (and is reflected in a lime arrow at the bottom of the indicator); if the line is below the second negative threshold, the line is colored fuchsia (also reflected as an arrow); if the line is between thresholds, it is colored aqua.
The Price Delta Heatmap can be used in various trading strategies and applications. Some potential use cases include:
-- Trend identification : The indicator helps traders identify periods of high volatility and potential trend reversals.
-- Volatility analysis : By observing the color changes in the heatmap, traders can gauge the volatility of an asset and adjust their risk management strategies accordingly.
-- Confirmation tool : The indicator can be used as a confirmation tool alongside other technical indicators, such as trend-following indicators or oscillators.
-- Breakout trading : Traders can look for price delta bars of a specific color range to identify potential breakout opportunities.
However, it's important to note that the Price Delta Heatmap has certain limitations. These include:
-- Lagging nature : The indicator relies on historical price data, which means it may not provide real-time insights into price movements.
-- Sensitivity to thresholds : The choice of threshold values affects the indicator's sensitivity and may vary depending on the asset being traded. It requires experimentation and adjustment to find optimal values.
-- Market conditions : The indicator's effectiveness may vary depending on market conditions, such as low liquidity or sudden news events.
Traders should consider using the Price Delta Heatmap in conjunction with other technical analysis tools and incorporate risk management strategies to enhance their trading decisions.
Open Interest Profile [Fixed Range] - By LeviathanThis script generates an aggregated Open Interest profile for any user-selected range and provides several other features and tools, such as OI Delta Profile, Positive Delta Levels, OI Heatmap, Range Levels, OIWAP, POC and much more.
The indicator will help you find levels of interest based on where other market participants are opening and closing their positions. This provides a deeper insight into market activity and serves as a foundation for various different trading strategies (trapped traders, supply and demand, support and resistance, liquidity gaps, imbalances,liquidation levels, etc). Additionally, this indicator can be used in conjunction with other tools such as Volume Profile.
Open Interest (OI) is a key metric in derivatives markets that refers to the total number of unsettled or open contracts. A contract is a mutual agreement between two parties to buy or sell an underlying asset at a predetermined price. Each contract consists of a long side and a short side, with one party consenting to buy (long) and the other agreeing to sell (short). The party holding the long position will profit from an increase in the asset's price, while the one holding the short position will profit from the price decline. Every long position opened requires a corresponding short position by another market participant, and vice versa. Although there might be an imbalance in the number of accounts or traders holding long and short contracts, the net value of positions held on each side remains balanced at a 1:1 ratio. For instance, an Open Interest of 100 BTC implies that there are currently 100 BTC worth of longs and 100 BTC worth of shorts open in the market. There might be more traders on one side holding smaller positions, and fewer on the other side with larger positions, but the net value of positions on both sides is equivalent - 100 BTC in longs and 100 BTC in shorts (1:1). Consider a scenario where a trader decides to open a long position for 1 BTC at a price of $30k. For this long order to be executed, a counterparty must take the opposite side of the contract by placing a short order for 1 BTC at the same price of $30k. When both long and short orders are matched and executed, the Open Interest increases by 1 BTC, indicating the introduction of this new contract to the market.
The meaning of fluctuations in Open Interest:
- OI Increase - signifies new positions entering the market (both longs and shorts).
- OI Decrease - indicates positions exiting the market (both longs and shorts).
- OI Flat - represents no change in open positions due to low activity or a large number of contract transfers (contracts changing hands instead of being closed).
Typically, we monitor Open Interest in the form of its running value, either on a chart or through OI Delta histograms that depict the net change in OI for each price bar. This indicator enhances Open Interest analysis by illustrating the distribution of changes in OI on the price axis rather than the time axis (akin to Volume Profiles). While Volume Profile displays the volume that occurred at a given price level, the Open Interest Profile offers insight into where traders were opening and closing their positions.
How to use the indicator?
1. Add the script to your chart
2. A prompt will appear, asking you to select the “Start Time” (start of the range) and the “End Time” (end of the range) by clicking anywhere on your chart.
3. Within a few seconds, a profile will be generated. If you wish to alter the selected range, you can drag the "Start Time" and "End Time" markers accordingly.
4. Enjoy the script and feel free to explore all the settings.
To learn more about each input in indicator settings, please read the provided tooltips. These can be accessed by hovering over or clicking on the ( i ) symbol next to the input.

Volume / Open Interest "Footprint" - By LeviathanThis script generates a footprint-style bar (profile) based on the aggregated volume or open interest data within your chart's visible range. You can choose from three different heatmap visualizations: Volume Delta/OI Delta, Total Volume/Total OI, and Buy vs. Sell Volume/OI Increase vs. Decrease.
How to use the indicator:
1. Add it to your chart.
2. The script will use your chart's visible range and generate a footprint bar on the right side of the screen. You can move left/right, zoom in/zoom out, and the bar's data will be updated automatically.
Settings:
- Source: This input lets you choose the data that will be displayed in the footprint bar.
- Resolution: Resolution is the number of rows displayed in a bar. Increasing it will provide more granular data, and vice versa. You might need to decrease the resolution when viewing larger ranges.
- Type: Choose between 3 types of visualization: Total (Total Volume or Total Open Interest increase), UP/DOWN (Buy Volume vs Sell Volume or OI Increase vs OI Decrease), and Delta (Buy Volume - Sell Volume or OI Increase - OI Decrease).
- Positive Delta Levels: This function will draw boxes (levels) where Delta is positive. These levels can serve as significant points of interest, S/R, targets, etc., because they mark the zones where there was an increase in buy pressure/position opening.
- Volume Aggregation: You can aggregate volume data from 8 different sources. Make sure to check if volume data is reported in base or quote currency and turn on the RQC (Reported in Quote Currency) function accordingly.
- Other settings mostly include appearance inputs. Read the tooltips for more info.

Range Analysis - By LeviathanThe Interactive Range Analysis script is an essential tool for analyzing price ranges. It automatically draws important range levels, generates a Volume Profile or Open Interest profile and horizontal/vertical heatmaps, plots the anchored VWAP, draws Fibonacci levels, and much more.
How to use the indicator:
1. The script will prompt you to select the "Start Time" and "End Time" using Tradingview's interactive interface. These two points will determine the length of the range.
2. Once you have selected the range, the script will automatically anchor the range highs and lows to the highest and lowest close/wick/hlc3/ohlc4 (whichever you prefer).
3. You can then begin exploring different tools and options such as Quarters, Eighths, Fibonacci, Outer Levels, VWAP, Horizontal Volume/OI Heatmap, Vertical Volume/OI Heatmap, Fixed Range Volume Profile, Open Interest Profile, Value Area, VAH, VAL, and POC.
4. You can adjust the range by dragging the Start Time and End Time anchors or by removing/reapplying the script.
Tool overview
Range Levels
After selecting your preferred time range, the script will identify and draw a range high level and a range low level, which serve as a base for other important levels. “Half” is the level halfway between the range high and range low. “Quarters” will, as the name suggests, split the range into four equal zones (quarters) and “Eighths” will split the range into eight equal zones (eighths).
”Fibonacci” option allows you to display Fibonacci retracement levels (0.786, 0.618, 0.382, 0.236). “VWAP” will plot a Volume Weighted Average Price, anchored to the start of the range. “Direction” input lets you choose whether your range is UP or DOWN trending in order to make sure that the Fibonacci levels and labels are generated and assigned correctly. With “Outer” turned ON, the script will also generate active levels (quarters/eighths/Fibonacci) above and below the selected price range. “Extend Right” will extend all levels to the right indefinitely, while “Extend (+Bars)” lets you choose how far right the levels get extended. “Diagonal Line” is drawn from the bottom left of the range to the top right of the range or from the top left of the range to the bottom right of the range, depending on the “Direction” input.
Volume Profile / Open Interest Profile
After selecting the “Data Type”, Volume Profile or OI Profile can be generated by turning ON the “Volume/OI Profile” option.
“Resolution” input defines the amount of nodes/rows in the range that are used in profile/heatmap generation for distributing the data. While you can increase the “Resolution” to get better, more granular profiles, you should keep in mind that you might need to lower the resolution when generating profiles for larger ranges.
”Node Type” offers you two options when it comes to the representation of data: Up/Down - divides a node in two sections for up volume/OI and down volume/OI, Total - one node for total volume/OI and Delta - net difference in up volume/OI and down volume/OI.
”Profile Position” lets you choose whether the profile is positioned on the left side of the range or on the right side of the range.
“Profile Direction” determines whether the profile nodes are facing right or left.
“Profile Type” enables you to visualize the nodes in a classic way (Type 1) or in a way where down volume/negative OI are positioned on the left side of the y axis and up volume/positive OI on the right side of the y axis.
“Node Size (%)” defines how much space in the range can be taken by the profile’s nodes. Eg. 50% will allow the largest node to extend to the middle of the range (and others scaled accordingly), 100% will allow the largest node to extend the max right point of the range (and others scaled accordingly).
”Value Area (%)” defines the VA zone, which represents the area where the most volume occured (usually 70% or 68%).
”Horizontal Heatmap” will display a heatmap-like overlay, that will help you identify the price levels where most volume/open interest action occurred.
”Vertical Heatmap” will display a heatmap-like overlay, that will help you identify the points in time where most volume/open interest action occurred.
A more detailed description of this indicator is coming in the next few days.
Important:
* If volume or OI profile does not get generated, try lowering the resolution.
* Once in a while, the script will disappear from your chart. Just remove and reapply.
* Open Interest data is only avaiable on Binance Perpetual Futures pairs
To learn more, read the tooltips in the indicator’s settings and stay tuned for upcoming additions (Range Market Structure, Liquidation Levels, Range Statistics,…)

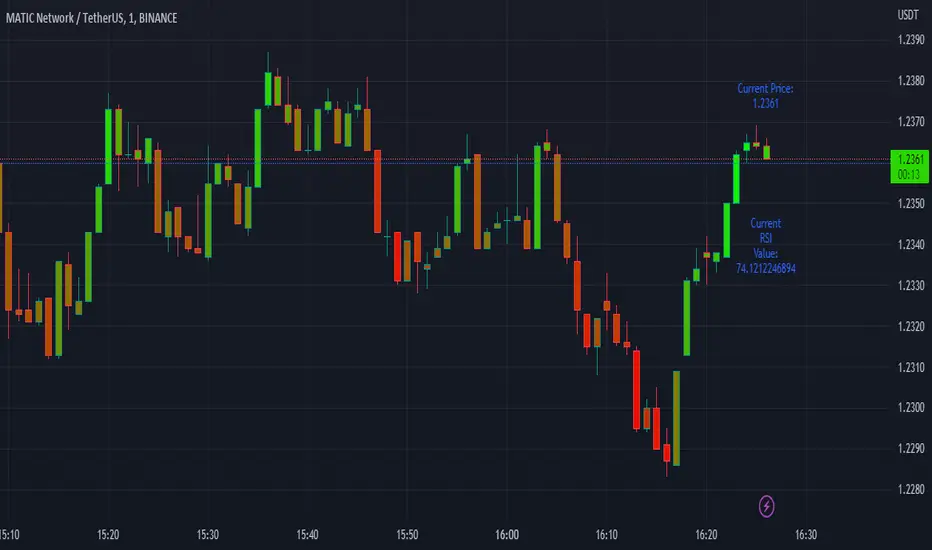
Easy RSI by nnamWhat Does this Indicator Do?
The Easy RSI Indicator color codes candles based on their RSI Value vs. Open / Close (Red / Green). It plots the current price and current RSI value on the chart in real-time. Additionally, when the RSI Value is in an oversold or overbought condition, it plots that signal on the chart in real-time.
The initial candle color is the standard Red / Green Tradingview color, but a Gradient is added to the color which either darkens or lightens the color based on the RSI Value.
As seen in the screenshot below, the higher the RSI Value, the brighter the Green Color is. The lower the RSI Value, the brighter the Red Color is.
The current Price and current RSI Value are both plotted on the chart by default, but can be optionally switched off by the trader.
As seen in the screenshot below, the prices and RSI Values are easily seen while visually tracking the price in real-time.
RSI Overbought Values are plotted when the Overbought condition is triggered. The Default is RED for Overbought and GREEN for Oversold.
As seen in the screenshot below, with all three labels turned on under the input settings (these are ON by default) you can see the overbought condition, the current RSI Value, and current price all in one centralized area. Oversold Values are also plotted when turned on under the input settings.
As shown in the screenshot below, the candle is GREEN (as evident by the green candle outline) but the RSI Value is low and shows lower than average relative strength. This turns the bar color ORANGE vs, GREEN showing that the relative strength of the move is subpar.
As shown on the screenshot below, if the trader has the standard Tradingview Price label switched on (in the Tradingview Chart Settings), the color of the bar is also translated to the price are for an easy to recognize RSI Value just by looking at the price. Even if the current candle is RED, when the RSI is higher than lower, the color will be green / greenish and even if the current candle is GREEN, when the RSI Value is lower than higher, the color will be red-ish / orange in color giving the user a quick view of RSI Value.
If you have any questions or feature requests for this Indicator please do not hesitate to reach out and ask.
GOOD LUCK trading!!
~nnamdert
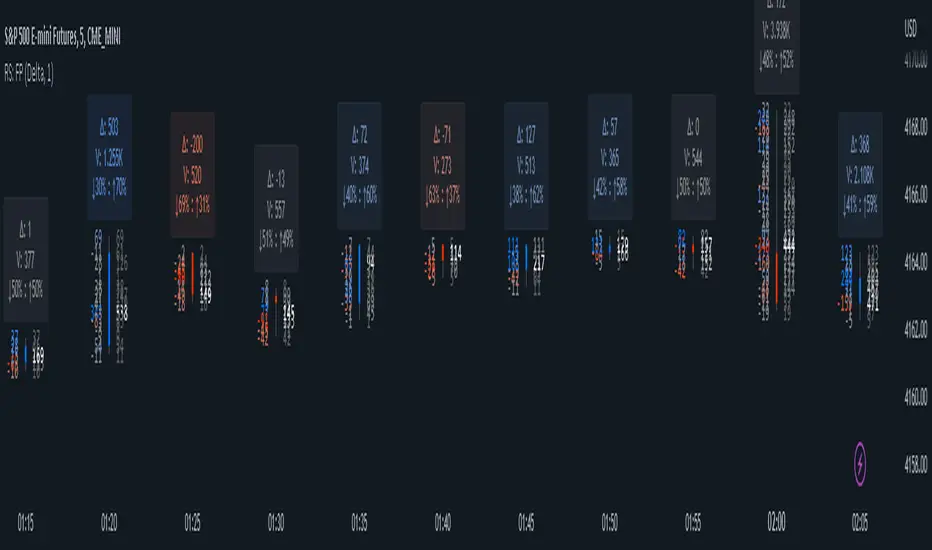
RS: FootprintThis is live only Footprint indicator.
Warning: TV does not provide tick by tick data and updates come in snapshots . Based on this, this indicator can never show precisely what is happening on the bid/ask. What it shows is only an approximation that works well enough if the tape is not too fast.
Use it at your own risk, with the warning above in mind!
Footprint can be used in two modes:
Delta - with bid/ask delta numbers on the left, at the same price level and the total volume numbers on the right
Bid vs Ask - with the bid on the left and the ask on the right; the coloring is based on the diagonal difference
Zoom in to fit the candles; optionally hide default candles.
Up/Down Volume + DeltaThis simple script is a modification of Tradingview's Up/Down Volume. In this case the delta between the buys and sells is plotted in columns style above the regular up/down volume columns. This gives a better visual of the dominant volume and is useful to spot divergences in tops and bottoms.
The indicators uses data from lower timeframe volumes. By default the lowest timeframe it will use is 1m, but for those that have a premium account you can try using a custom LTF set to seconds when scalping on the 1m chart.
Enjoy :)

Delta Ladder [Kioseff Trading]Hello!
This script presents volume delta data in various forms!
Features
Classic mode: Volume delta boxes oriented to the right of the bar (sell closer / buy further)
On Bar mode: Volume delta boxes oriented on the bar (sell left / buy right)
Pure Ladder mode: Pure volume delta ladder
PoC highlighting
Color-coordinated delta boxes. Marginal volume differences are substantially shaded while large volume differences are lightly shaded.
Volume delta boxes can be merged and delta values removed to generate a color-only canvas reflecting vol. delta differences in price blocks.
Price bars can be split up to 497 times - allowing for greater precision.
Total volume delta for the bar and timestamp included
The image above shows Classic mode - delta blocks are oriented left/right contingent on positive/negative values!
The image above shows the same price sequence; however, delta blocks are superimposed on the price bar. Left-side blocks reflect negative delta while right-side blocks reflect positive delta! To apply this display method - select "On Bar" for the "Data Display Method" setting!
The image above shows "Pure Ladder" mode. Delta blocks remain color-coordinated; however, all delta blocks retain the same x-axis as the price bar they were calculated for!
Additionally, you can select to remove the delta values and merge the delta boxes to generate a color-based canvas indicative of volume delta at traded price levels!
The image above shows the same price sequence; however, the "Volume Assumption" setting is activated.
When active, the indicator assumes a 60/ 40 split when a level is traded at and only one metric - "buy volume" or "sell volume" is recorded. This means there shouldn't be any levels recorded where "buy volume" is greater than 0 and "sell volume" equals 0 and vice versa. While this assumption was performed arbitrarily, it may help better replicate volume delta and OI delta calculations seen on other charting platforms.
This option is configurable; you can select to have the script not assume a 60/ 40 split and instead record volume "as is" at the corresponding price level!
I plan to roll out additional features for the indicator - particularly tick-based price blocks! Stay tuned (:
Thank you!
Open Interest Delta - By LeviathanThis script plots Open Interest Delta (change in OI). It also draws a heatmap and colors chart's candles to help you identify bars with large OI increase or decrease and apply Open Interest analysis concepts to your trading.
Positive OI Delta = net increase in open/unsettled positions
Negative OI Delta = net decrease in open/unsettled positions
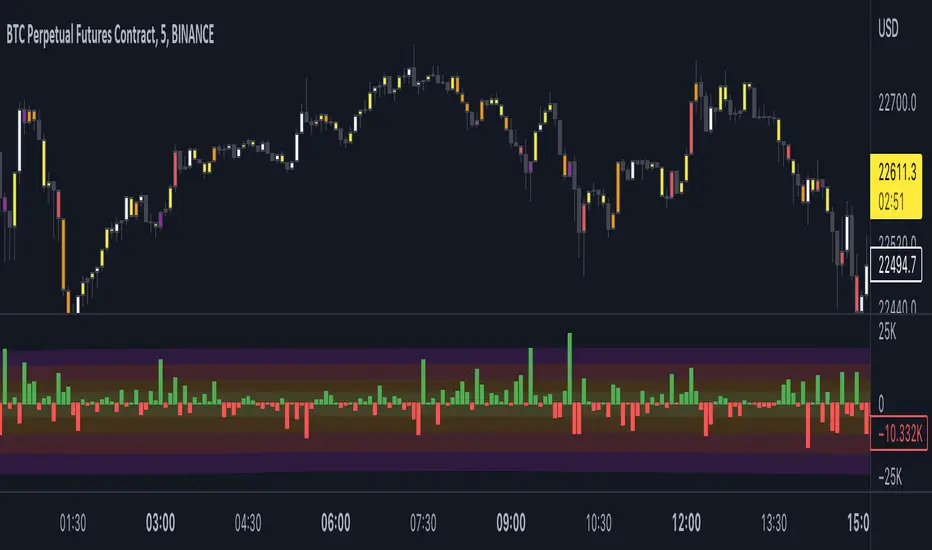
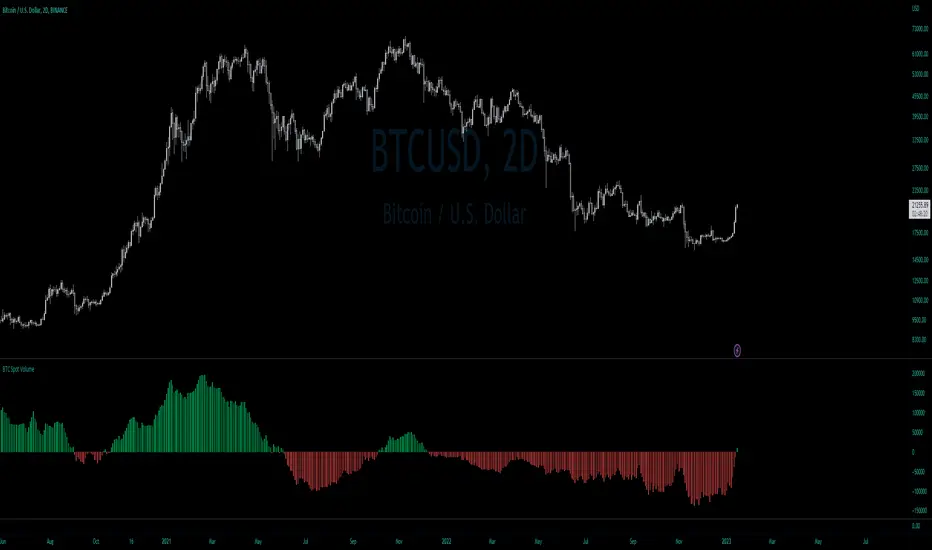
BTC Net Volume (Spot) (by JaggedSoft, fixed by SLN)• WHAT:
This indicator plots the aggregated net volume delta of BTC spot pairs from 8 exchanges over the last 60 periods (default settings).
Tracks the following pairs:
"BINANCE:BTCUSDT"
"BITFINEX:BTCUSD"
"POLONIEX:BTCUSDT"
"BITTREX:BTCUSDT"
"COINBASE:BTCUSD"
"BITSTAMP:BTCUSD"
"KRAKEN:XBTUSD"
"BITGET:BTCUSDT"
"GEMINI:BTCUSD"
• HOW TO USE:
Used for confirmation when watching futures that can experience quick movements in the form of liquidation-events. If the oscillator is green or trending upward, it's confirming a positive bias. The inverse is true for a negative bias. This is especially true on higher timeframes.
Can also be used to find correlations between different tech-assets.
• NOTES:
I forked JaggedSofts indicator to fix the data-source error it was having. Let me know if you want to customize exchanges or add more pairs, maybe I can add that in the future!
This indicator replaces the outdated alternative linked here : Please only use this one
• LIMITATIONS:
Only tested with normal japanese candlesticks .
• THANKS:
to the creator of this script, JaggedSoft. It's a great indicator!
• DISCLAIMER:
Not financial Advice, use at your own risk.
Aggregated Volume Spot & Futures ⚉ OVERVIEW ⚉
The indicator presents a comprehensive approach to Aggregated Volume Data . Works on almost all CRYPTO Tickers!
The script also includes several input parameters that allow the user to control which exchanges and currencies are included in the aggregated data.
This script allows the user to choose from several data display modes, including volume, spot & perp, delta, cumulative delta, and others.
The user can also choose how volume is displayed (in assets, U.S. dollars or euros) and how it is calculated (sum, average, median, or dispersion).
WARNING Indicator is for CRYPTO ONLY.
______________________
⚉ SETTINGS ⚉
‾‾‾‾‾‾‾‾‾‾‾‾‾‾‾‾‾‾‾‾‾‾
Mode — Choose Mode.
• Volume — This displays the Volume
• Volume (Colored) — Shows aggregated volume but applying different volume colors for different exchanges.
• Delta — This displays the difference between the number of sellers and buyers.
• Cumulative Delta — This displays the cumulative delta between sellers and buyers.
• Spot & Perp — Shows Spot and Futures volume at the same time.
• Delta (Spot - Perp) — Shows the difference between Spot and Futures Volume.
• Liquidations — Displays Potential Liquidations. (Calculated between the difference in volume between Futures and Spots)
• OBV — On Balance Volume.
• MFI — Money Flow Indicator.
• Data Type — Choose Single or Aggregated data.
• Single — Show only current Volume.
• Aggregated — Show Aggregated Volume.
Volume By — You can also select how the volume is displayed.
• COIN — Volume in Actives.
• USD — Volume in United Stated Dollar.
• EUR — Volume in European Union.
• RUB — Volume in Russian Ruble.
Calculate By — Choose how Aggregated Volume it is calculated.
• SUM — This displays the total volume from all sources.
• AVG — This displays the average price of the volume from all sources.
• MEDIAN — This displays the median volume from all sources.
• VARIANCE — This displays the variance of the volume from all sources.
* 🡅 Be Careful, Reacts to Every Mode.
Additional features
• Show MA — Show Movieng Average of Volume.
• MA Period — Period of MA.
• Lookback — Lookback period for 'Cumulative Delta' and for 'MFI'.
• Liquidation Filter — Filters out small or negative difference values.
• Show Table — Table shows the current volume of the last candle. Also in the Mode "Colored" shows the color of exchanges if they have volume.
________________
⚉ NOTES ⚉
‾‾‾‾‾‾‾‾‾‾‾‾‾‾‾‾
I don't pretend to be the best choice for calculating CVD , Delta and Liquidations, the calculations are chosen to be optimal from what I have seen and know.
If you have any ideas what to add to my work to add more sources or make calculations cooler, suggest in DM .

Price Change AlertsThis purpose of this indicator script is to reduce time traders spend staring on the charts.
For example if you're trading BTCUSD you can set alerts to be trigered by desired delta amount, for example 50. Then you can receive push notifications on your phone (need to install the tradinview app) and on your desktop computer every time price changes by amount of 50. Simple and easy.
To enable alerts do this:
- Click on alerts clock icon in top right corner of the screen
- Click on "Create alert button"
- In Condition dropdown select "alerts"
- In the next dropdown select "Any alert function() call" and click on "Create" button
Script uses repainting on purpose to display daily percentage changes since the previous day's closing and to triger alerts.

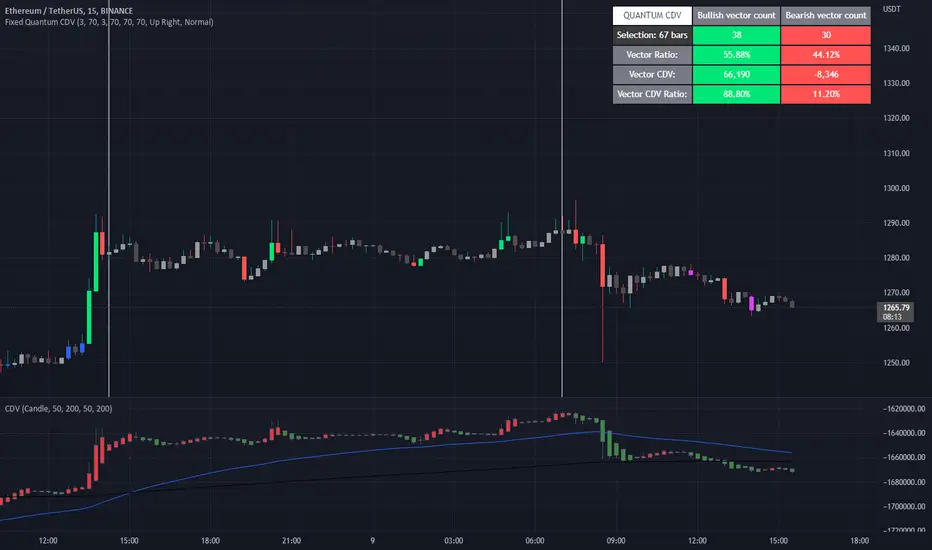
Quantum CDV HistogramThis script is an addition to Fixed Quantum Cdv.
It shows vector cdv ratio in columns.
You can select the length as an input to how many bars to look back for the whole calculation.
The green bars represent the bullish values and the red bars the bearish values.
The green line represents an ema of the bullish value and the red line the ema of the bearish value.
The momentum ema (in purple) represent the cdv ratio (bullish - bearish).
When the momentum ema is at 100% or more it’s a good sell opportunity and when the momentum ema is at or under 100% it’s a good buy opportunity. It is not financial advise. Make sure to make your own analysis. This script help to make entries, but do not enter positions only based on this signal.
In the inputs you can select the emas that you want to display on your histogram.
The original script is the Cumulative Delta Volume by LonesomeTheBlue.

Fixed Quantum CDVWe took the original script Cumulative delta volume from LonesomeTheBlue, here is the link:
To understand the CDV you can watch traders reality master class about CDV.
This indicator show the ratio of vector color and the ratio of the cumulative delta volume from vector color.
First you select a date range on the chart. Then it calculate all candles in that region. Let's say there is 3 green vectors and 3 red vectors in the region, the ratio of vector color will be 50% for bull and 50% for bear vector. As for the CDV ratio, it will measure the total CDV inside green vector and total CDV inside red vector and make a ratio. But it is a little different.
I twisted the calculation for the ratio of CDV a little bit to make it more comprehensive in the table. Since it's the ratio of the CDV for the bull candles versus the bear candles, the CDV is almost always a positive number for the bull candles and almost always a negative number for the bear candle. So I calculated the bear CDV as a positive number. Formula: Bull_CDV_ratio = Bull_CDV / (Bull_CDV + Bear_CDV), Bear_CDV_ratio = -Bear_CDV / (Bull_CDV - Bear_CDV).
Note that when the bull CDV and bear CDV are both a positive number or both a negative number, the ratio percentage can be over 100% and under 0%. It means that we expect volatility.
Enjoy!